Gold – Big Picture
The day to day price movements can be frustrating or exciting, but the larger picture is more important (to me at least). I want to be on the right side of the trade. This is where cycle analysis come in. On the following chart I’ve marked golds 4, 8, and 16 year cycles. The time zones marked in red show when all 3 cycles are heading down – gold price will fall. The green zones show when all 3 cycles are heading up – gold price will rise. The blue vertical lines show the 16 year, so called K-Wave peaks, with gold price highs occurring at those points, about two-thirds of the way through golds 8 year cycles. The next peak appears to be due in late 2026. Pullbacks expected into 2020 and 2024. On that basis, I’d expected a sharp move up in 2018 and 2019, and again 2021 to 2023, with a final , possible parabolic move to the final peak taking place after the 2024 low into 2026. Here’s my chart, and I hope it helps a bit in terms of a roadmap…
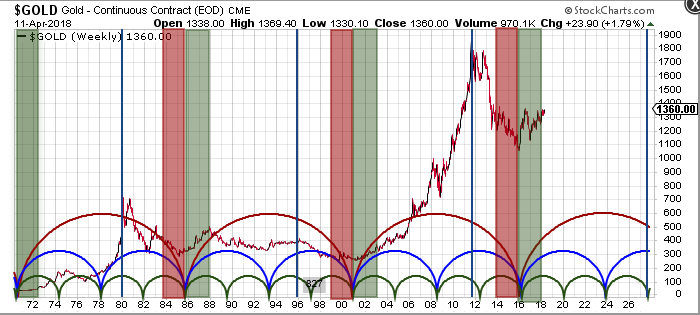
The 16 year cycle from 1985 to 2001 was interesting. Price action was incredibly muted. My explanation for this is an expanding economy coinciding with a cyclical uptrend in equities, and, crucially, the dollar index. The stock marked soared during this period, and sucked investment away from PM’s. The dollar index cycle was up from 1995 to 2002. This prevented gold (priced in dollars), from realising its potential. The index rose from 80 to 120, effectively cutting golds potential dollar value in half. So, what’s the situation today ? If the stock market is at a low point, having just suffered a proper bear market, and if the dollar is at a cycle low, with years of rising ahead, gold will struggle badly. If the stock market is nearing the end of a historic bull run, and the dollar is coming off it’s cycle high and heading for its next cyclical low, gold’s full potential will be unleashed. Where do you believe we are ? Invest accordingly.
Excellent chart , excellent reasoning.
The hard part is the “patience”
Here’s a big picture thought
In 1981 there was runaway inflation that drove interest rates and Gold into Parabolic territory. Leading to a huge credit crunch and massive inflows of cash into the US because of 20% plus yields as well as Iran issues in the middle East.
In 2011 the rogue nation of Libya was selling Oil for Gold and stockpiling huge amounts of physical Gold as well as starting the first African Dinar Gold backed currency. Oil prices reached ATH’s. Finanacial crisis 07/08. Nations were buying Physical Gold to purchase Oil from Africa…
The only rogue nations IMO in 2018 are N Korea, China, Venezuela, Russia, Syria, Iran. The rogue nations appear to be getting back in line at the moment. IMO following a few petty Tonnes of inflow into the GLD every month doesn’t really have the same effect as previous parabolic rallies. Nothing is off the table and fundamentals change quickly anything can happen. Watching waiting expectations held in check just my .02. The possibility of liquidity and SM events maybe?
What are the drivers that make you as optimistic as the previous two parabolic Gold rallies NS? The previous financial crisis of 08 crushed PM’s along with everything else?
Today’s environment looks like the second cycle period in the chart, 1988-2001. Back then it was falling inflation and booming economy, today its falling inflation, moribund economy. (Yes, we have inflation spikes) No matter how I look at the economy, even through Trump glasses, I see nothing on the horizon that says we get a booming economy, especially since not only is debt at record levels but demographics are working overtime to put the brakes on any potential growth from Trumponomics.
In a conventional economy you need rapid growth in the labor force to generate rising GDP. We have the opposite, and if Trump gets his way he is going to trigger a depression all on his own by cutting back on immigration. Without that immigration the labor force shrinks.
But now we have something even worse. An unconventional economy. For the first time in history we have the capability of replacing labor with machines on a very large scale. Add in Trumponomics and you have a recipe for long term contraction.
So how does gold go up in that environment?
There are a million questions and a million answers. If, how ?, why ?, what ?, when ? Many, many arguments on both sides, to which I don’t have a definitive answer. I prefer to stick to the simple, known facts, hence the chart. The K-Wave peak is in 2026, and the gold exhibits the cycles I’ve shown. The stock market is not at a cyclical low, and neither is the dollar. All of those things ‘suggest’ much higher PM prices ahead. The world of geo-politics is something of a distraction as far as I’m concerned – the markets are lining up in such a way that gold will benefit to the fullest extent from this particular cycle into 2026. Take a look at the SPX/Gold ratio for example. All of the turning points that are being reached in the markets are telling me the low at $1050 is behind us, we’ve climbed 30% in less than 3 years, and the biggest gains are ahead of us.
Geo Politics a distraction lol.
Geo Politics IMO is what makes the world go round and gives everything purpose. The graphs, lines, and chart trends that’s Billions of people who made little decisions in the past. Lines on a graph do not make decisions people do, likewise just because you drew a line on a chart does not make it set in stone.
The charts are history NS the future is Billions of decisions yet to be made by people, anticipate the trend maybe?
Thanks for your post NS. May we both profit from the future.
Completely disagree RL, that’s like saying that Winter won’t happen again because it’s in the past. The cycles don’t stop happening just because we have a new president or something kicks off in Middle East. Geo politics matters enormously, but it won’t stop the gold cycle or dollar cycle. Investment cycles can be impacted by external forces, but they don’t stop – just like the seasons. A warm spell in Winter, or a cold spell in Summer won’t stop the cycles from continuing.
NS you only look at $US cycles am I wrong?
Just because it’s winter in the UK doesn’t mean it’s not summer in Australia. May I suggest you broaden your charting horizon to a Global perspective.
Here is a challenge only chart in foreign currencies for the rest of the week, is that possible? I take it your FIAT of choice is the Pound but hey let’s thrown in the Euro as well. The Euro was almost the new reserve currency until mysterious wars and refugee crisis struck Europe. Wow that’s strange how did that happen? A rival to the $US plundered by one crisis after another. I digress. How bout all those bullish Gold charts in the Pound and the Euro cause Summer is Summer everywhere as you say.
You must’ve missed my posts on the CHF/USD ratio ? As for the pound – it’s even better looking than the chart in dollars. I only post stuff if I think it’s relevant. I keep an eye on gold in other currencies, and will post if I see something that adds to the picture (bullish or bearish).
What’s fascinating about cycles and mathematics is they leave the people out. But if you remove the people, why do the cycles even happen? I’ve noticed over the years that conventional economists make forecasts based on mathematical constructs, as if people don’t matter. Then the people do what people do, and the forecasts fall flat. So I’ve learned to pay attention to the people. My preference is for the technical side, but if you don’t account for the fundamentals the technical cannot exist.
Natural cycles happen regardless of people of course. Financial cycles happen because of people. People are cyclical. You can go into minute detail, but it’s as simple as that.
Thanks Northstar.
I’ve been contemplating, recently,the PM relationship to Quantum Mechanics. You know the part where everything (atomic particles) acts one way when observed and another way when unobserved. Maybe a little less observing would help the PMs. Who knows?