AB=CD Symmetry
I like symmetry, I like finding it. I especially like finding it embedded in other waves.
I posted this picture a little bit ago about what I think gold can do to finish out the normal seasonality that ends March 1.
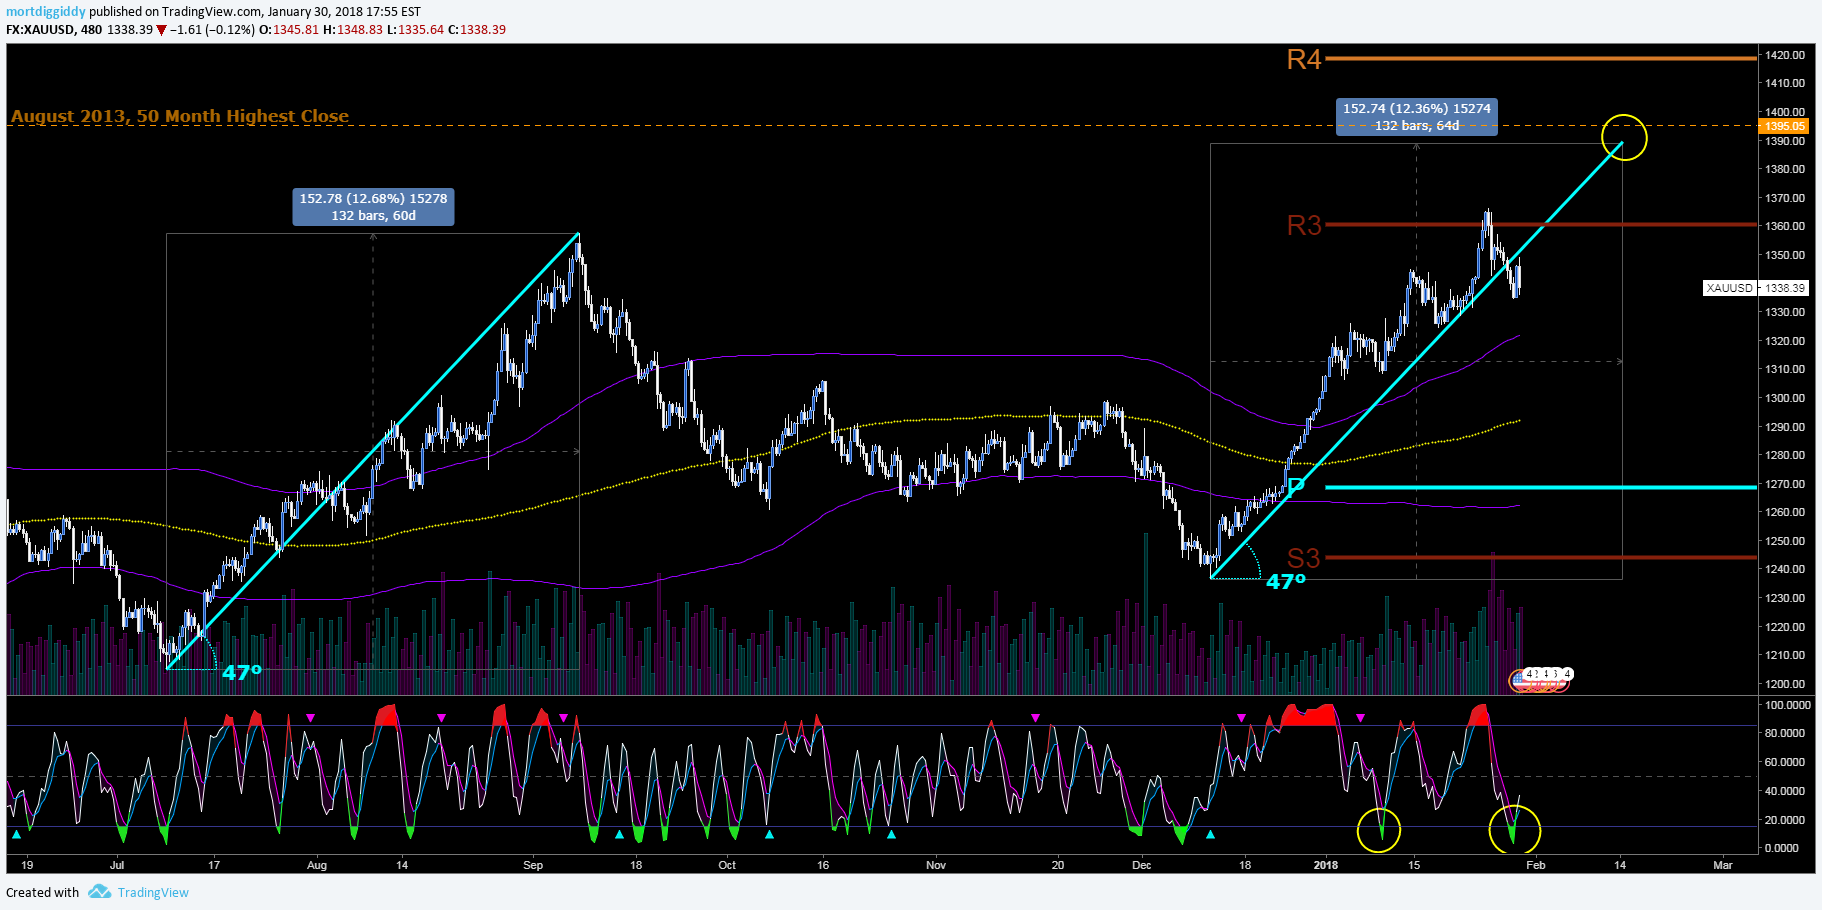
Since then, it has transformed. It is still above the 200 period bollingers (1 standard deviation) and I am still bullish. There is catching up to do however to meet the same angle as the first large wave back in July-September.
The equal wave target is about 1390, which just so happens to be very near a VERY important month close price from the past. Pull up the month chart of GLD or XAU and you will see why… it was the highest month close for a very long time (and I believe highest weekly close as well).
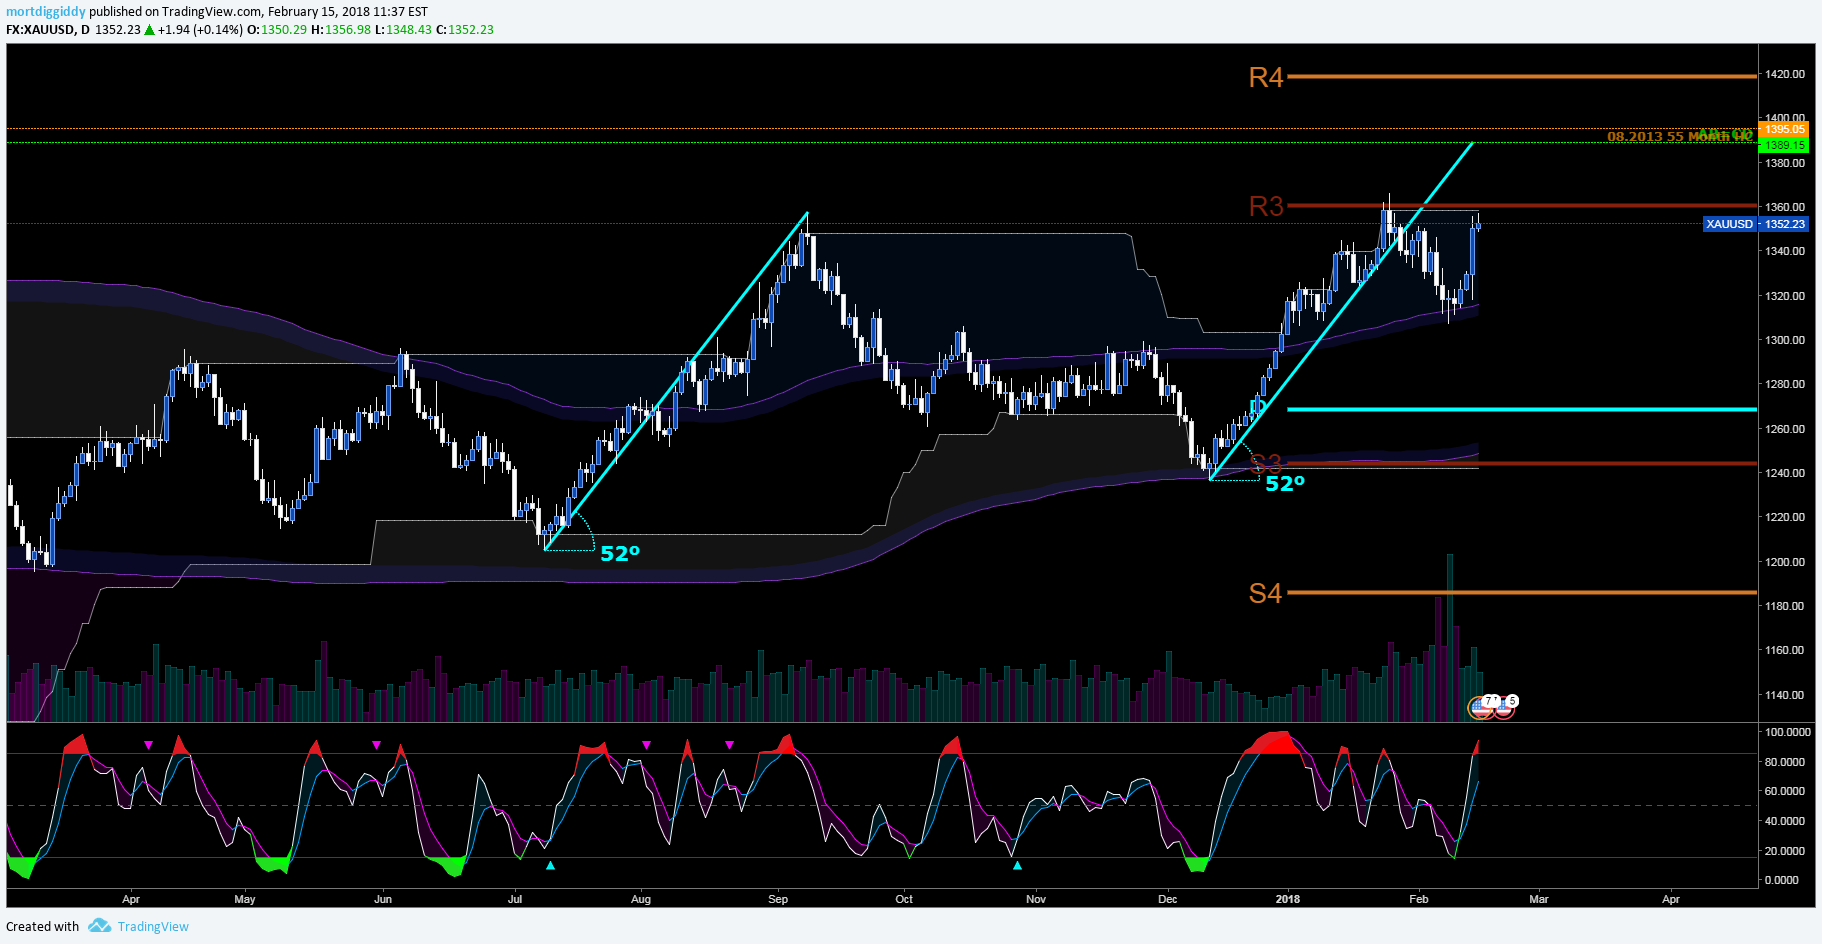
I added the Year Camarilla pivot levels to show why I think we topped out where we did in the 1360ish levels. That was my target in December, the Year R3 level there at the top. I use CAM levels for day/week/month/year. They are extremely effective.
Here is the price action for yesterday. My thoughts are the impulse that began yesterday that sparked a mega reversal “SHALL END HOW IT BEGINS”. What does this mean? It is an equal wave buying pattern that I love (I really love it). You can find them everywhere to be honest, on all time scales. The bigger the better.
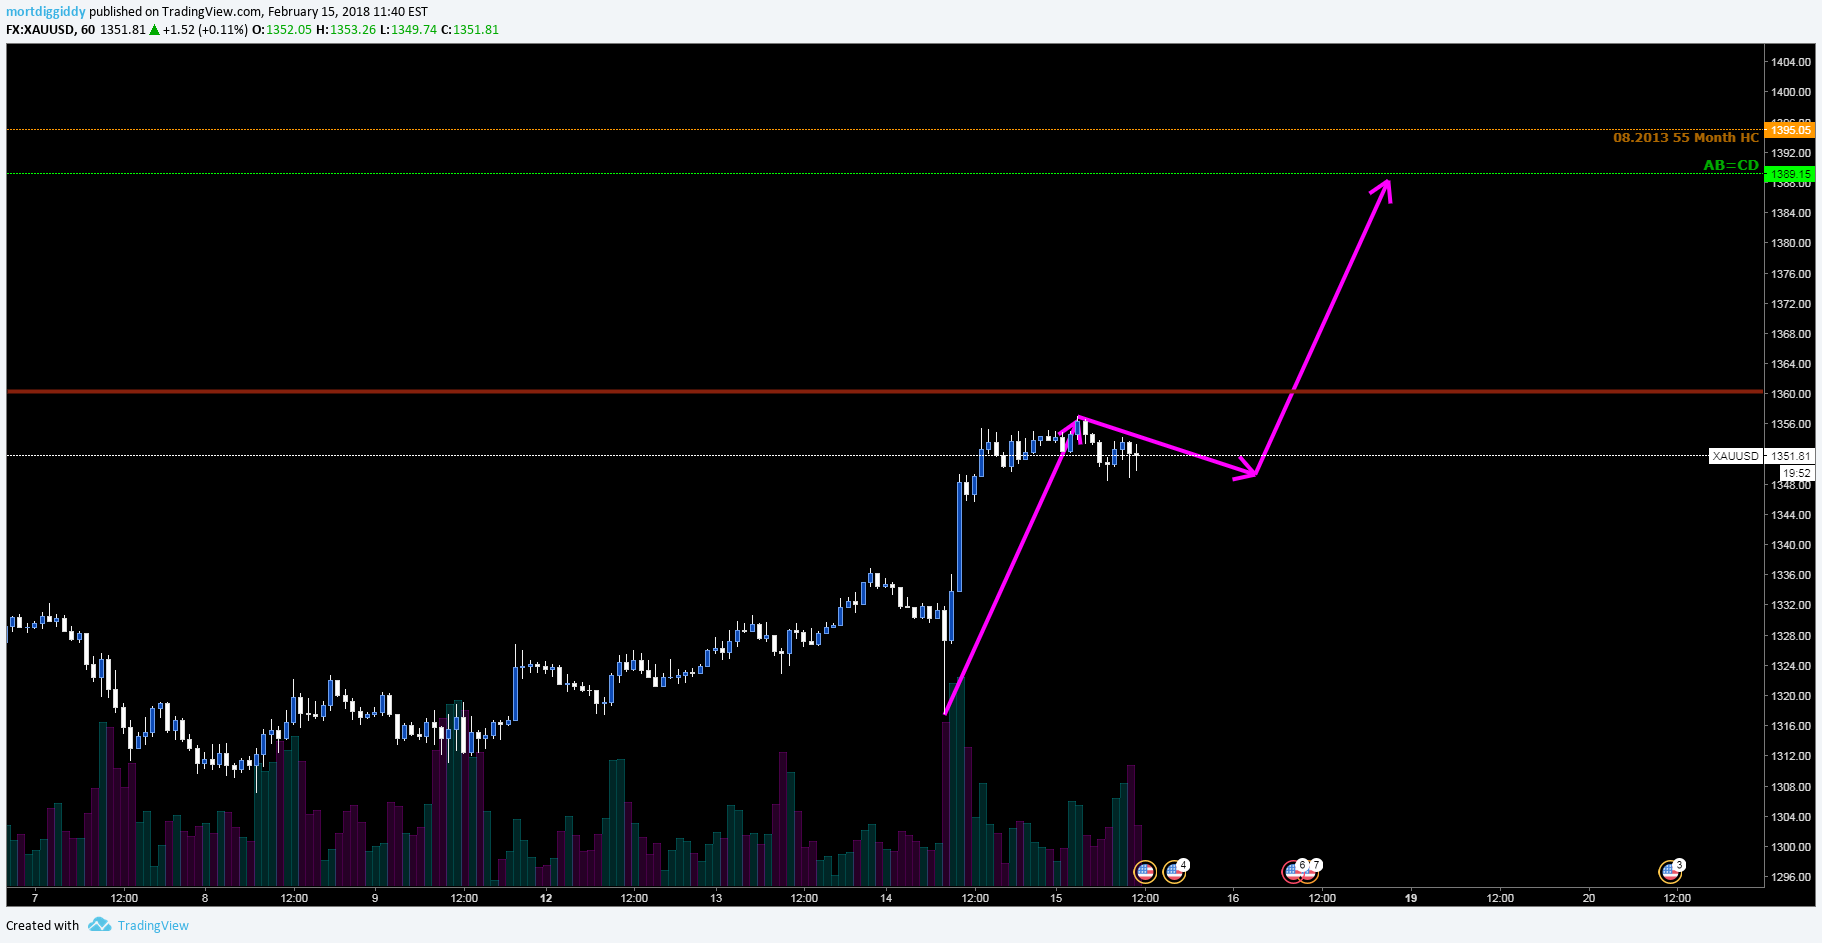
If the wave up on Wednesday ends how it begins… and we don’t go much lower than here, that equal wave, or AB = CD, pattern will put it right at that master target level as well. It is an embedded wave pattern that is pointing at the same AB = CD level for the July-September era. If what I think will happen, happens… this is going to occur sooner rather than later.
Sharing is caring.
Thangs Morty. Very interesting.
Will fit my view.
good stuff. thnx. school of hard knocks for you or did ya take some external learnings, different methods you use from us old timers and just curious, maybe I head back to school?? Probably end up like Dangerfield tho
You have to lose to win. Nothing teaches more than loss.
I have explored many trading ideas and strategies… I think I kind of blend them together to fit the needs of the trade. Eventually you just get a feel for things after seeing it so many times. I never attended any courses or anything… just mass absorption over the years… and reading everything I could get my hands on. I subscribe to a few services and those help too.
Nothing is better than collaboration among others that are equally willing to learn and explore new ideas… everyone has something to offer with their unique view point. Sometimes the new guys need a little old school reminder. I try to incorporate both.
I am learning a lot from these tutorials Morty
Thanks for sharing….I do get a bit blurry eyed looking at all the info
Yes hard knocks is a must.
We once had a guy here who used only indicators….He claimed he Never ever had a down year….wouldn’t embrace any other techniques….long gone now….hanging out with other Neanderthals .
I can’t grasp it. I shall re-read it a coupla three times and try to comprehend it. I’m beginning to think They lied to me about my IQ.