The Dollar & Gold – Learning From The Past
As the old saying goes, history may not repeat, but it rhymes. That’s especially true of financial markets. They’re governed by human behaviour, investment cycles, peaks/troughs and above all, a degree of mathematics. All very interesting, but so what ? Well, it means that we can look back at earlier investment cycles to get clues about where we’re going in the next few months/years. This works less well for day to day trading, because there’s all sorts of ‘low level noise’ which can cause short term ups and downs. For example, a political event or statement of some kind. All of that just amounts to ripples in the ocean though, and they’re drowned out by the larger forces at play.
In the modern monetary and financial era (post Bretton Woods, and more importantly when you’re talking about the dollar, post gold standard in the early 70’s), there have been 3 complete dollar cycles. We’re currently in the 4th. we can look at the 3 previous cycles for clues. This is what I’ve concluded…
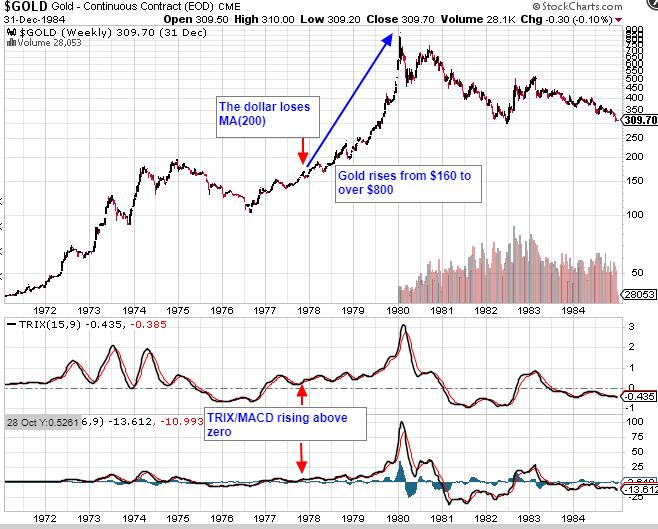
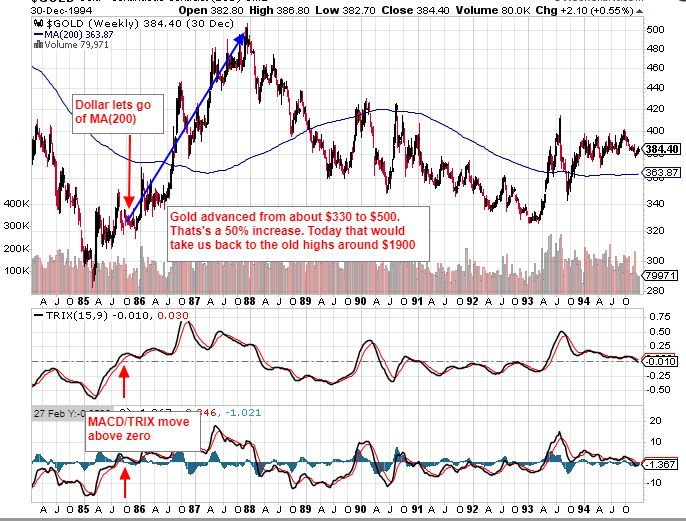
- Once the dollar loses the MA(200) on the weekly chart, that’s it – lights out, look out below.
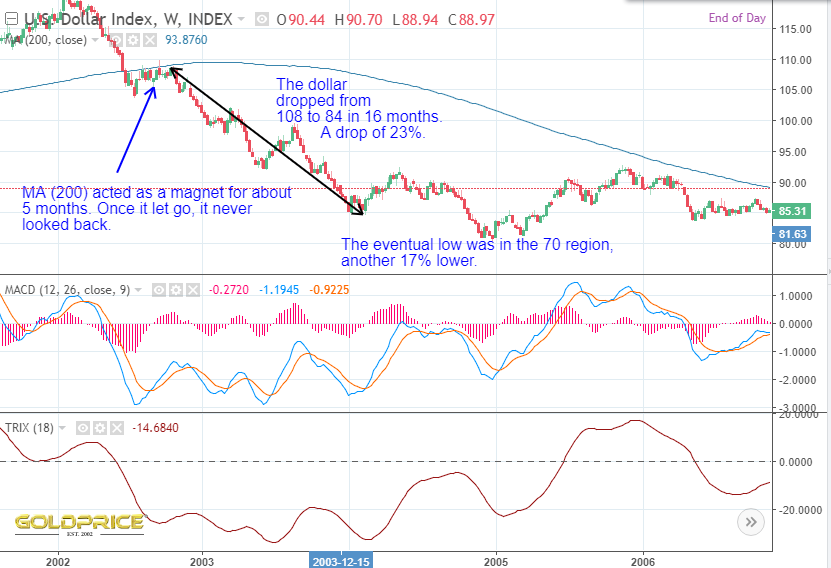
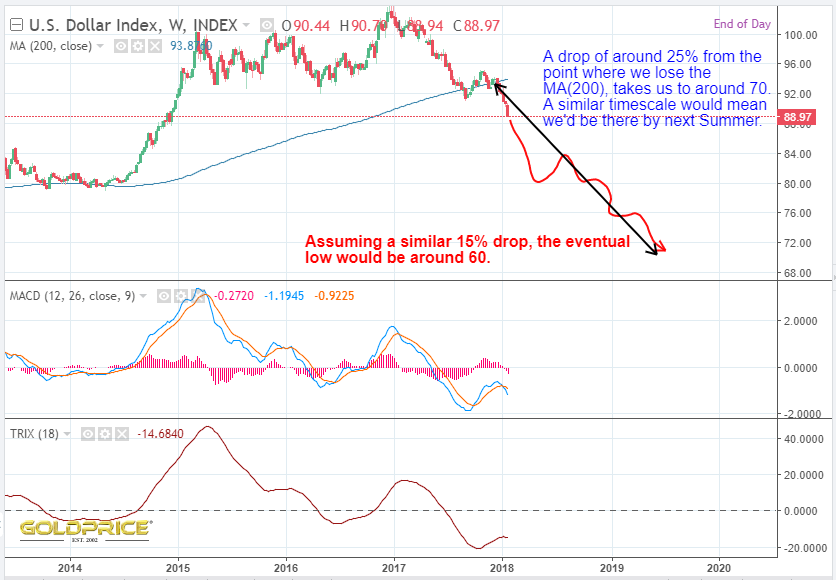
- There is an initial plunge of the order of 25 %, followed by sideways to down price action for a number of years. I’m wary of the smaller drop in the late 70’s for various reasons, even though it was accompanied by a huge spike in gold.
- The dollar index spikes down another 15% or so to its final low, again, paying less regard to the late 70’s cycle
- At the same time (unsurprisingly) gold takes off
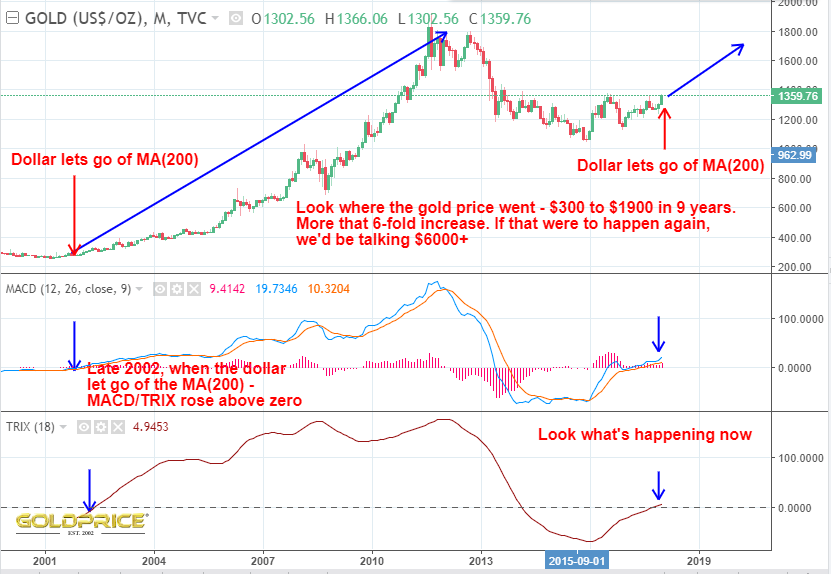
- MACD and TRIX on the gold charts confirm this is happening NOW
- Golds target in this cycle is a minimum of $1900, but likely a good deal higher. I’m unsure how high at this point – some of my work suggests the $2500 area, but $6000 and $9000 keep cropping up.
Here are the charts. Look at what happened in 1977, 1985 and 2002. Then look at what’s happening now…
1977

1985

2002 and today
Fascinating, Northstar. Excellent post…and if you are right, we are heading into the best of times, worst of times…
Indeed.
I still stick to my previous point. $USD is simply an index, a mathematical construct, of which nearly 60% of the weighting consists of the Euro, a political construct.
Therefore, if the viability of the Euro is ever called into question (it will), Euro dumps and $USD spikes. Given that “Euro viability” would a a drawn out process I would imagine,
you would be looking at a rally in $USD of probably at least one year, which could be absolutely vicious.
Good point Jenkins….IF the Euro blows up….Gold would benefit IMO…..finally decoupling
That is definitely possible.
In Italy the LEGA party yesterday have officially candidate two economists that wanna leave the euro.
This party seems that have strong ties with Trump,his leader is against Germany and EU.
Agreed, I think Italy is the country at greatest risk of leaving the Euro in the coming years.
I will make a party if this “risk” will happen
If the Euro blows up Europeans will buy physical Bullion and Crypto’s like never seen before IMO. It’s the physical buying like in 2016 over Brexit that drives larger Bull markets IMO.
Excellent Presentation Northstar
What do sailors do when they are lost , adrift . ..Follow the Northstar
Well, hopefully all the great posters here can help to guide us through whatever is coming
Very interesting Northstar,now we have to wait to see how long the gold ascent will last.
In the 70’s and in the 80’s it lasted about 2 years,in the 00’s 9 years.
In the 70’s gold was in a bull market,in the 80’s in a bear market and in the 00’s in a bull market again.
So,if history will repeat (rhyme) we have at least a couple of years positive for gold.
Timing will ,as always, vital in order to succeed .
Quite right Mamare- timing is crucial.
Great insight NS. How do define “cycle” when you say… in this cycle a minimum of 1900″ for gold.
The 16 year cycle that bottomed in 2016 and will bottom again in 2032. The peak in gold should occur in the mid 2020’s. So a minimum if $1900 by then, but I would say there’s a 60-80% likelihood of seeing $2500 to $6000 and a smaller chance of $9000 or more. It will become clearer as this year and next year progress. I’ll keep posting updated targets. I’ll look at the mining indices in the next day or two.
This is top-notch research. Thank you!
Thanks. You’re very welcome
Northstar I like your work on the World USD Index, I’ve been using the $USD. From what I’ve noticed is after the $US goes to roughly 80 or below $USD for an extended duration that is when Gold uncouples from currencies and takes on a life of it’s own. Not sure what or if the correlation exists with the World USD Index. Food for thought.