My Dow/Gold Ratio Theory, Soon to Be Tested.
My apologies in advance to Fullgoldcrown for the scenario put forth in this post.
Please note, however, that I am able to admit that I’m wrong if it becomes apparent that I am wrong.
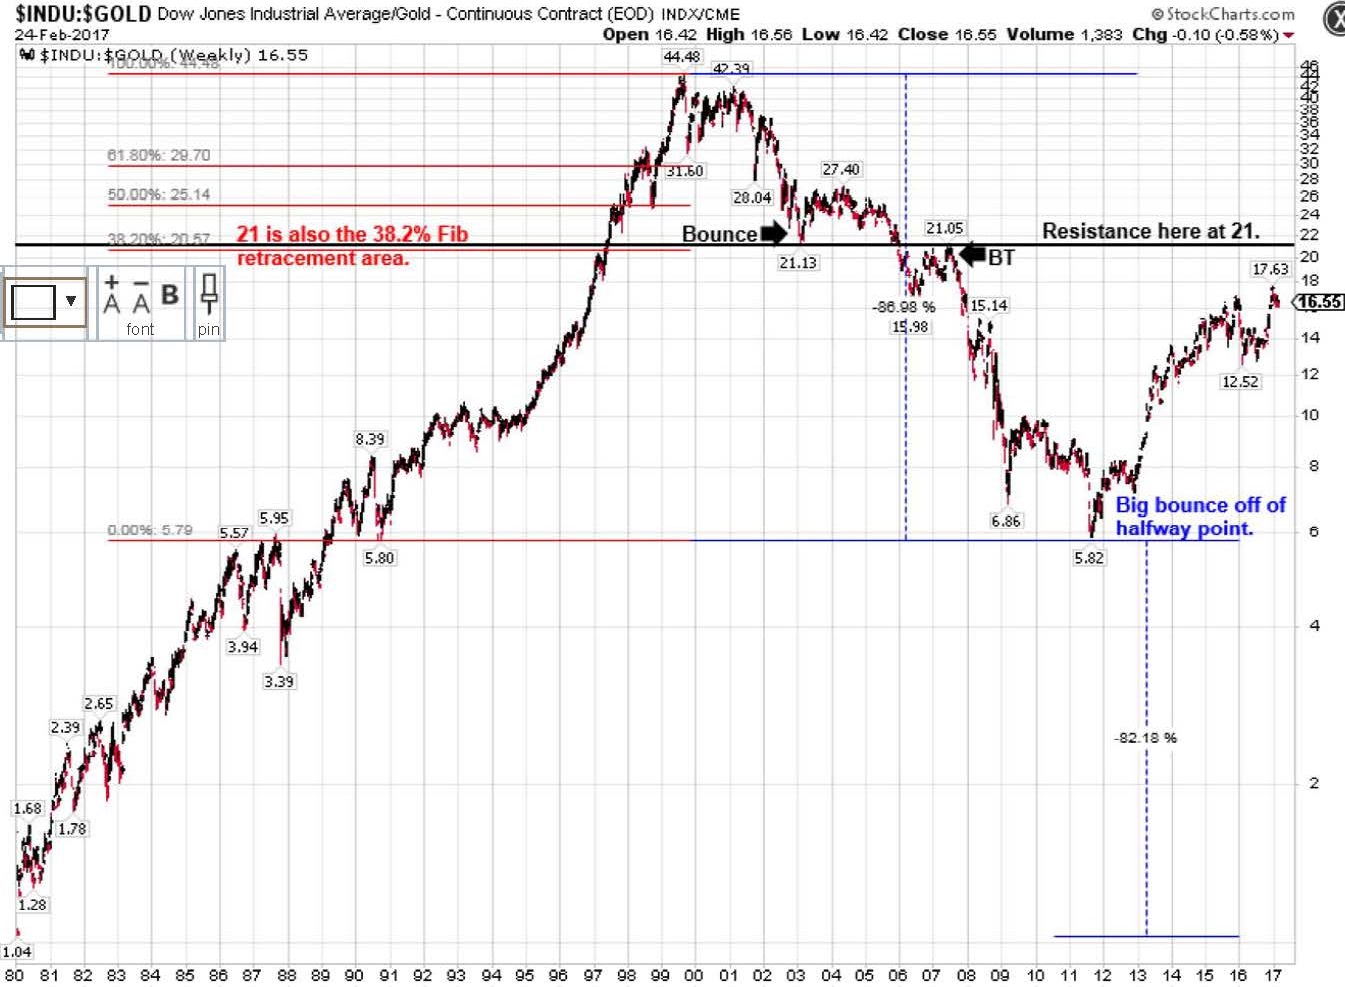
Above is a chart of the Dow/Gold ratio I posted back in late February 2017. I theorized that the ratio had dropped from its peak in 1999 to a temporary bottom in 2011 which was roughly the half way point to its ultimate ratio of 1 to 1. The theory also suggested that this ratio could rise from that 2011 bottom around 5.8 to a 38.2% fib retracement and price resistance area around the 21 range. Note that this multi year bounce from 2011 is viewed as a corrective move in a long term trend downward.
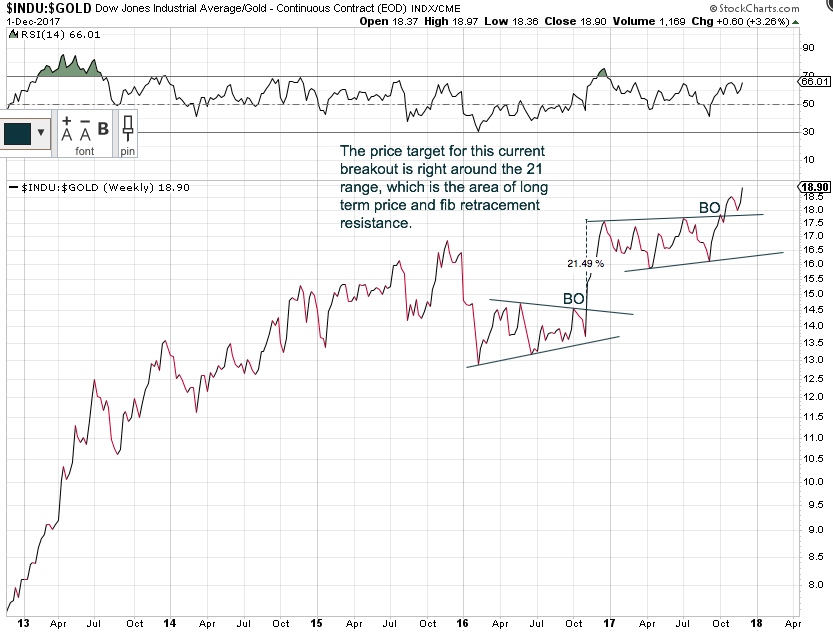
Now it appears this ratio has broken out of another consolidating wedge and could be on a final impulse leg up to that 21 range. The measured price objective would suggest that anyway. The interesting part is that if the theory is correct, then very big things are shaping up for sometime in 2018. Once this upward trend reverses I think it will be quite eye opening. And while I believe the ratio will drop, I have no idea how exactly it will play out with regard to stock and gold prices. Let’s just say I think either gold will go up while stocks come down, or both will go up together but with gold outpacing stocks. Calculate that if you dare. We’ll keep watching.
Excellent post and chart Neil…Bookmarking this one and I think we need another tab on the right!
Very nice. Definitely goodnwork.
Much appreciated
Sorry all haven’t been saying many thanks lately. I’m a depressed gold investor
Great chart Neil, though I think that you are a bit too positive but I’m an ultra depressed gold stocks investor so don’t take me seriously
Mserr and Mamare you guys are providing a good countrary buy signal. I think the Fed meeting coming in December will be close to the bottom for PMs and miners. IMO, you buy when your fightened/depressed and sell when your exuberant.
Interesting Theory Thank You.
The one very disturbing thing on your charge is the Halfway Retracement to the winter of 1987. I’ve seen the exact same thing in the Au/Cu charts and there are screaming 1987?
1987 was not exactly stellar in a few ways..
Check out the Au/Cu charts if you get time I’d would like to here your opinion on them.
Thanks