Rambus Interview – An Observation
Fully posted a link earlier. I read it too fast and thought it was posted recently, but realised my mistake when I looked at his gold chart.It was published around about the time gold hit it’s $1050 low. In it he says…
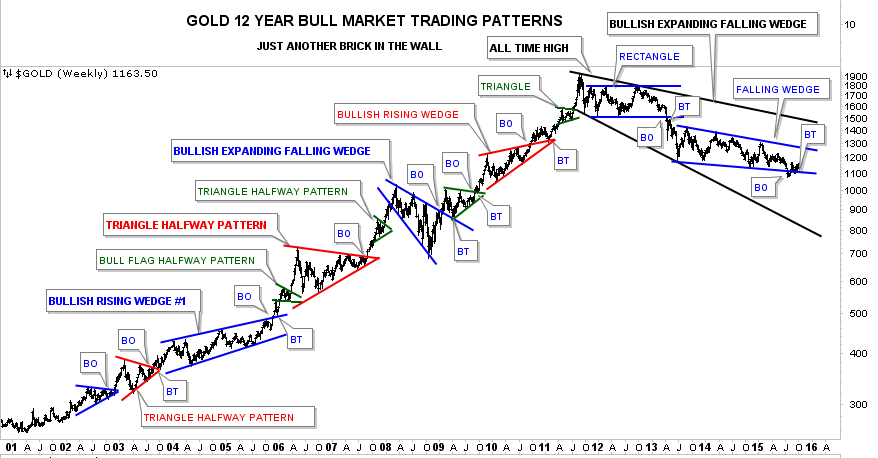
‘Since gold has been in a bear market since 2011, the latest chart pattern that has formed is the two-plus years blue falling wedge, which I consider to be a halfway pattern to the downside when all is said and done. Just look at the left side of the chart during the bull market years when each consolidation pattern broke out to the upside. Now look at how our current bear market is unfolding opposite to the bull market. This is how markets work.
On a bullish note, gold could be forming the last consolidation pattern within this bear market. If the blue falling wedge breaks out to the downside, which I expect it will, this next impulse move down may very well complete the bear market. As you can see, I’ve labeled this four-year bear market as a possible bullish expanding falling wedge. You can compare this possible bullish expanding falling wedge to the same pattern that formed the low for gold during the 2008 crash — it’s the same pattern, just on a longer time-frame. Even though I’m bearish for the short-to-intermediate term, I can still see the bull market continuing when the top black rail of the potential bullish falling wedge gets broken to the upside.‘
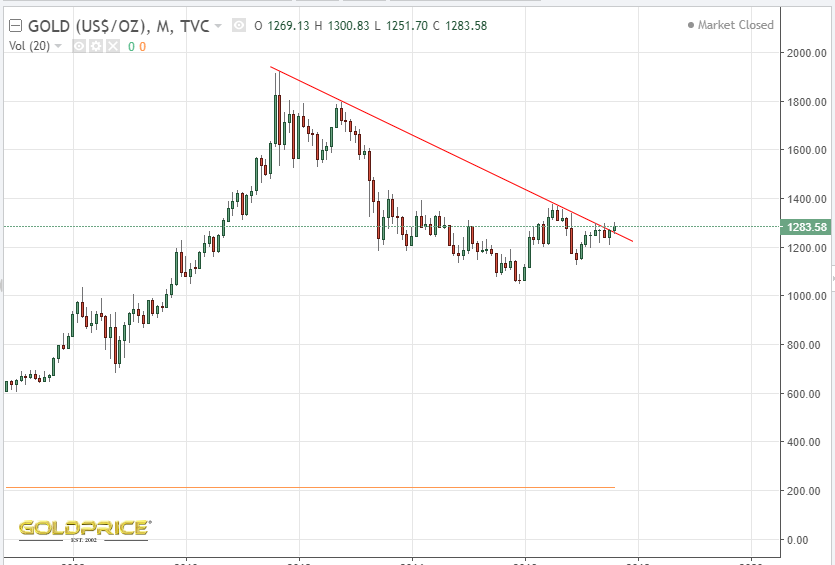
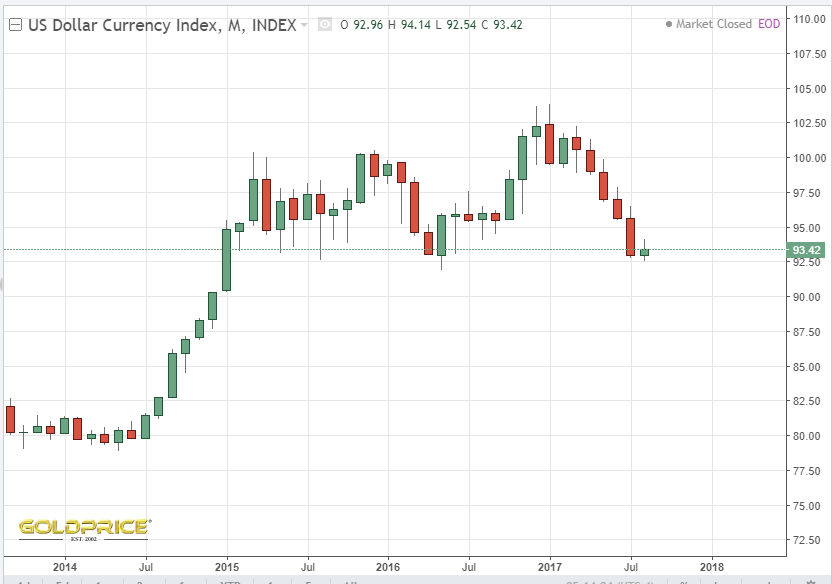
He included these 2 charts…

As we now know, he was right to an extent. The dollar did breakout upwards, but (due to the long established, and predictable dollar cycle), it has come all the way back to where it started. He wasn’t right about gold though. The falling wedge didn’t break down, but up. It hasn’t proven to be a halfway pattern to the downside. Gold has risen over $200. I’m not entirely sure why gold didn’t fall a little further or at least stay around the $1000 mark for the rest of 2016. Like Rambus, I would’ve expected it to. The gold cycle would’ve certainly allowed it. At the time, I remember reading an article by ‘Zeal’ on the Market Oracle website, which demonstrated that whatever gold was going to do, the PM mining shares were at an ‘absurd low’ that just could not be maintained, and that the upside over coming years is huge. I did my own research and was convinced. I put all my savings into a a portfolio containing most of the HUI and GDX companies. HUI was about 120 at the time. It feels now, to me, that gold began it’s upward charge too early, and the weak action recently has been the result. You need all of the wind behind you. It’s like weather forecasting – to get a CAT5 Hurricane, rather than a tropical depression, you need all the causing factors to be in place, not just a few of them. This is EXACTLY the same. However, if I’m right, the long term cycles that I’ve been banging on about, are about to reassert themselves hastening the dollars continued fall, and bringing about golds renewed bull. Here are the gold and dollar charts, so you can see what happened after the Rambus post.
At the same time, we have geo-political tensions rising, we have a US president in ‘trouble’, we have a debt ceiling debarcle approaching, the stock market is euphoric, the national debt is off the scale and rising EXPONENTIALLY, the dollar cycle is in its declining phase and the gold cycle is in it’s rising phase.
A CAT5 hurricane is in danger of developing.
Totally agree NS. Time will tell as always.
A close below 92 on that USD index chart could set off a waterfall decline of at least 10%, as those holding dollars above that level, are under water and decide to bail at a loss.
A point of recognition.
I’m with you on that Spock. Hanging by a thread.
The symmetrical triangle effort wants to wear us off.
Sure does, but that’s a good thing at the birth of a bull.