Laying Down The Gauntlet
On a late Summers day, while the farmers make hay
we found a small spark, some light in the dark
that began to show us the way.
lines on the charts, that tug at your hearts –
gold will rise again, one day.
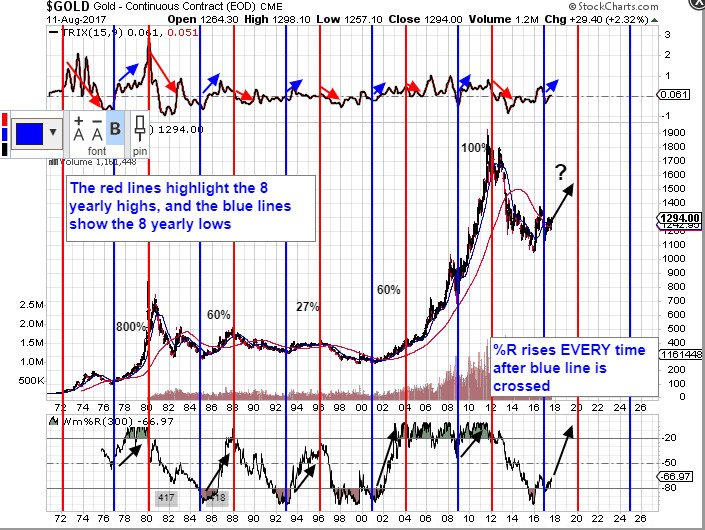
Well, according to my chart (copied again below), that day is pretty much here. So this is my challenge…
I have a chart which goes all the way back to the time the US came off the gold standard in the 1970’s. There is a ‘rule’ that you can apply to the chart for that entire duration that hasn’t ever been broken – when gold price moves from a blue line to the next red line (approx 3 years), the price rises and peaks at that red line. A move down, so that we are lower in 2020 than we are now would be the first time the rule has ever been broken. Anyone that thinks we are going to see prices fall – show me a) Why this chart will fail for the first time ever, and, b) Show me an equivalent chart, going back 50 years that proves your point. It needs to not just suggest a lower price 2 years from now, but it needs to demonstrate that by moving lower it is somehow behaving in a way that has been demonstrated in the past. If this can’t be done it shows that we are either going up, as my chart suggests, or the next 2 years will be completely unprecedented in the history of the gold market post 1970’s.
I should say, that I’m not a bull, blinded by the glitter of PM’s – I’m trying to be pragmatic and consider all angles. I would appreciate finding a strong counter argument – the charts just aren’t giving it to me. I’ve read lots of bearish predictions, but haven’t found one that stacks up in terms of showing how this chart will get broken for the first time ever. In isolation, I can find things to suggest gold might go down, but only short term. It’s the price in 2020 versus todays price I’m interested in. So, come on, someone, pick up the gauntlet 🙂
Northstar…I appreciate your work….and highly respect your evidence based approach.
While I cant show you any chart that disputes your thesis …a couple of observations.
I know you are sincere in your request for critique of your chart so…
1….It is a great chart and the cycles are compelling
2…I don’t see a high in 1972 …but that may be moot
3…We already had a change of character in your cycles…THE low hit early by a full year ( Jan 2016). yes there was a secondary low in Jan 2017 but it was a higher low….so we cannot say the 8 year cycle low was accurate this go round
4…This is a small sample size…the cycle bottoms have been accurate 5 times which is impressive but is it really historic ?…and now the sixth it was a year early
could the next cycle top also be a year early ? and could it be a lower high ?
5…I will say the chart strongly suggests we move higher into 2020 ( or 2019) but how much higher is NOT evident …we cant just take an average from the small (5) samples and assume that’s it…and we cant rule out this time will be a smaller jump than the others.
6…I will keep an eye on this great looking cycle but still rely on the daily charts for guidance .Rambus likes to say Cycles are great and they work until they don’t…
Cheers
Fully
PS…its all fun and games until someone loses an arm !
Great point at the end there Fully – and for everyone reading this, you MUST manage your funds very carefully and decide in advance at what point you will withdraw from your position if the worst happens. I’m lucky. I got in at HUI 120, so I have a large cushion. I’ll exit if the long term support at about $1170-$1180 is broken, and still have about 10-20% profit. If you got in at a later stage, you need to be much more cautious and probably only commit a smaller part of your available cash until $1300 is broken to the upside. To answer your points one by one…
1) Thanks
2) The US came off the gold standard in August 1971, so it took a while for the cycles to become established.
3) I agree. I think it’s withing the bounds of acceptability. I think that forced selling and liquidations forced the miners to an early and unsustainable low in late 2015/early 2016. The low ‘should’ve’ been later. Maybe that’s why we had a secondary low – the cycle had to complete.
4) Again, I have to agree. But it is the best part of half a century of cycles, with all kinds of geo-political events and financial calamities. Nothing has stopped this rule from working. Yet.
5) I’ve said many times that this doesn’t tell us how high we’re going to get by 2020. Just that the direction is up, not down.
6) Agreed.
’92 looks minimal stretch coming off relativel minor low.
But yea heading up just like 2001 trigger.
Yes, just a 27% advance that time. A very muted cycle.