Yesterdays Chart – Important Points
- I posted the chart below yesterday. I’ve been asked a couple of questions here and elsewhere when I showed it. I just felt I needed to explain a couple of points. The main reason for this particular chart was because I have wondered for a while if the period around 1983/84 could be our current position. That’s mainly because visually it does look very similar on the chart. Analogs and fractals can look very convincing, but, as a scientist, I need to find supporting evidence. So I looked at all of the indicators, to see if there were similarities or differences.
To be honest, most aren’t very helpful on this 50 year timescale, but a couple were, especially if you fiddle with the settings, and alter the Wm%R to 300. So what we’re looking at is overbought/oversold conditions as they develop on a 300 day rolling basis. By extending out the time frame this way, you are getting rid of a lot of the daily/weekly ‘noise’ and focusing on the ‘main signal’ or trend. This main signal or trend is much more reliable and predictable, compared to daily and weekly direction changes. The TRIX on it’s standard setting seems to works pretty well on this timescale. TRIX is also an indicator of overbought/oversold conditions and shows how momentum is moving in a particular direction. I view both of these indicators on these timescales as giving us clues as to the overall ‘direction of travel’.
It’s long been known that markets have cycles. The thing is that price sometimes reacts strongly in a cycle, and sometimes the price movement is weak. Also, the peak and trough in a cycle can be biased to the left or right in relation to the expected peak. That’s not an excuse for it not always working perfectly, it’s an acknowledgement of the fact that the real world is messy and a not 100% predictable. Nonetheless, these cycles are very evident in the gold market. The peaks and troughs on an 8 yearly cycle going back to the 1970’s are as clear as day and 100% reliable – they haven’t failed, so they would need something MASSIVE to make them fail now.
So back to my reason for doing this. Are we in 1983/84 ? The chart says categorically that we are NOT. From the point of view of determining where we are in the pattern this is a killer chart in my view. We cannot be in a position even remotely comparable to 1983/84, and here’s why. In 83/84 we were on our way to a %R LOW and TRIX was FALLING. Today the %R low has just happened, we are on our way to the HIGH and the TRIX is RISING. That’s because of where we are in the cycle. Think for a minute – this cycle hasn’t failed in its entire 50 year span. If %R and TRIX were to turn down now, taking price with it, it would be the first time in 50 years and 6 cycles that this has ever happened. As I said, for me, this is the killer chart. It demonstrates a 50 year pattern that has repeated every 8 years. It doesn’t tell us where the price will be at the peaks and troughs, bit it does tell you WHEN your peaks and troughs will be. 2020 is our next peak, 2024 is our next trough (may be a very small one), and the following peak will be in 2028. That’s 9 years from now.
I would strongly suggest referring back to this in 2 years time and thinking about taking profits at the top in 2020. I’m going to go long again in 2024, and exit the market for the last time in 2028, when I’ll be 59 and ready to retire.
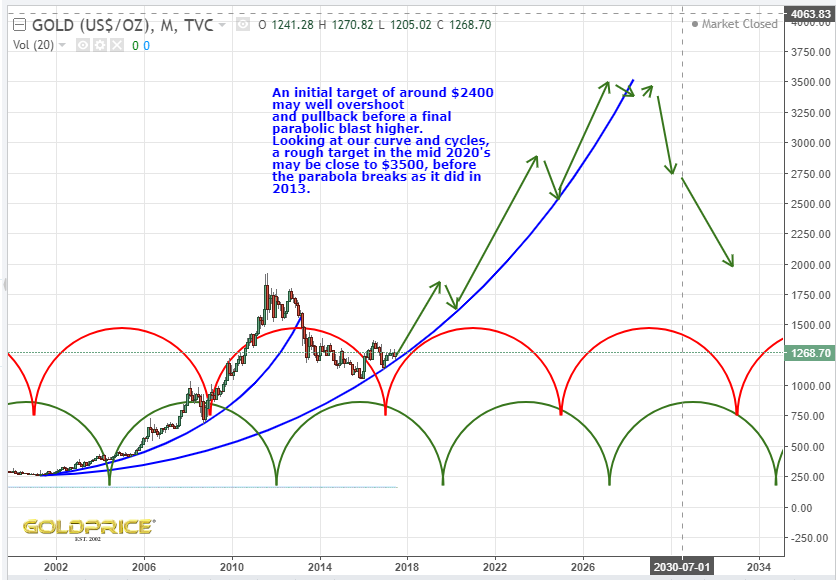
I’ve been asked what my price projection is for 2020. I’ll be posting fairly regularly on this over coming months, as my thoughts develop, but at the moment I’m favouring somewhere in the $2000-$2500 range. We’ll see how fast we start to rise, and then I’ll adjust my thoughts as new data comes in. I suspect that if I have to adjust my target, it will be upwards rather than downwards, but I’ll leave it there for now. Here’s that chart again…

Coincidentally, looking back at recent charts of mine, that 2024 trough and 2028 peak, agrees with one that I posted a short while ago. If it works out, we may be close to $3000 in 2020, dropping back to $2500 in 2024 and then $3500 in 2028. There are scenarios that take us a lot higher of course.
EDIT: Looking more closely at the dates, cycles, peaks and troughs, I would revise the troughs, or low points to 1985, 1993, 2001, 2009, 2017 and 2025.
Great work NS. It is interesting that many also see a big rise in commodities over that period as well. We may also see a big set back in the SM in 2018, which if Trump controls the fed (which he may well do by mid 2018), is likely to mean more QE and negative interest rates, lower dollar etc etc and, therefore, higher gold.
Lots to play for and my advice is to get all the help you can from both free and the better subscription sites, read as much as you can, and then make a decision but with some flexibility as no doubt there will be shocks along the way!
Quite right OJ. Well said.
Wonderful review.
Many thanks.?
Cheers MM.
Thank you Northstar. Appreciate the insight.
No worries Gallo 🙂