As Close To A Guarantee As You Can Get – Gold Going UP
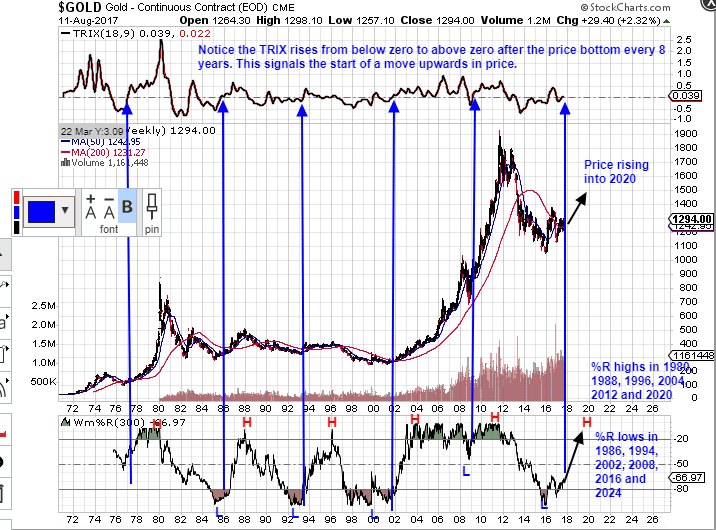
Study this one, very simple chart and let it sink in. The indicators are TRIX (18,9) and Wm%R(300). The following rules are true all the way back to the 1970’s….
1) %R peaks every 8 years
2) %R hits a low every 8 years
3) Just after the low, the new uptrend is confirmed by TRIX crossing from below zero to above zero. Price then moves UP.
We have just passed the %R bottom. TRIX has just crossed from below zero to above zero, giving us the confirmation of the price moving up into 2020.
This chart is screaming at us and there really can only be one outcome, otherwise the pattern all the way back to the 1970’s will be broken for the first time. How much simpler can it possibly get ?
Love it. There is no stopping you NS 🙂
Thanks OJ 🙂
I’m a believer! Thanks for this–see my bitcoin V.S. gold post on Rambus forum
Hi Richard, thanks. Unfortunately I’m not a subscriber on Rambus, so I can’t see any posts.
Thanks for this and all your other great posts! ?
Cheers MM. Glad you find them worthwhile 🙂
What is your price projection for gold in 2020 Nortstar?
Thanks NorthStar…Only one way which is UP
It looks to me like we are at the equivalent of mid-1983. If so, we have about a year and a half of declines ahead of us. Hope not, but that looks like where we are to me.
Hi Ken. Please see my most recent post where I run through this chart and what it is telling us in a little more detail, along with some price estimates. Cheers 😉