$9000 Too Much ?
Hi Goldtenters. My post on $9000 gold got a few responses yesterday, so I thought I’d follow it up with another scenario which needs watching. At this point I’m discounting any scenarios involving a move to $1000 (or less). My bullish bias has been well explained on my recent posts covering a variety of factors. I remain bullish until/unless the long term support near $1180 is challenged.
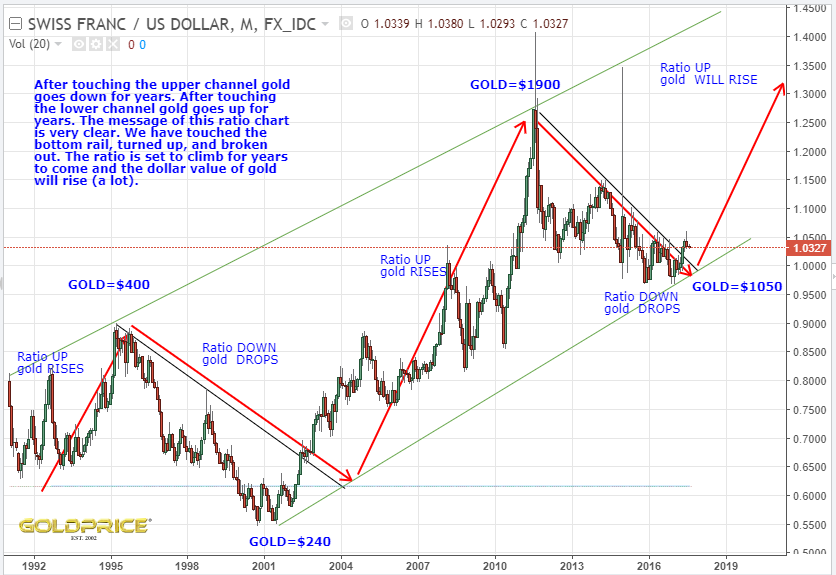
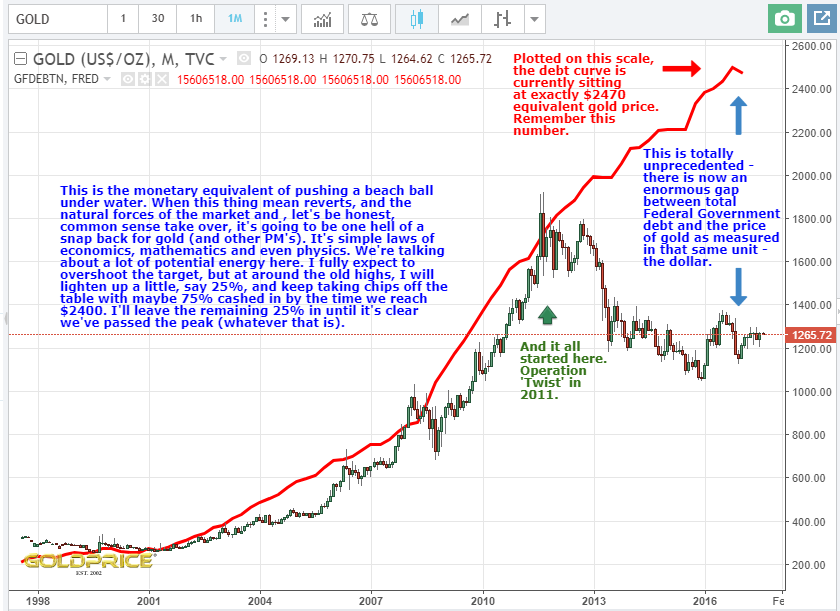
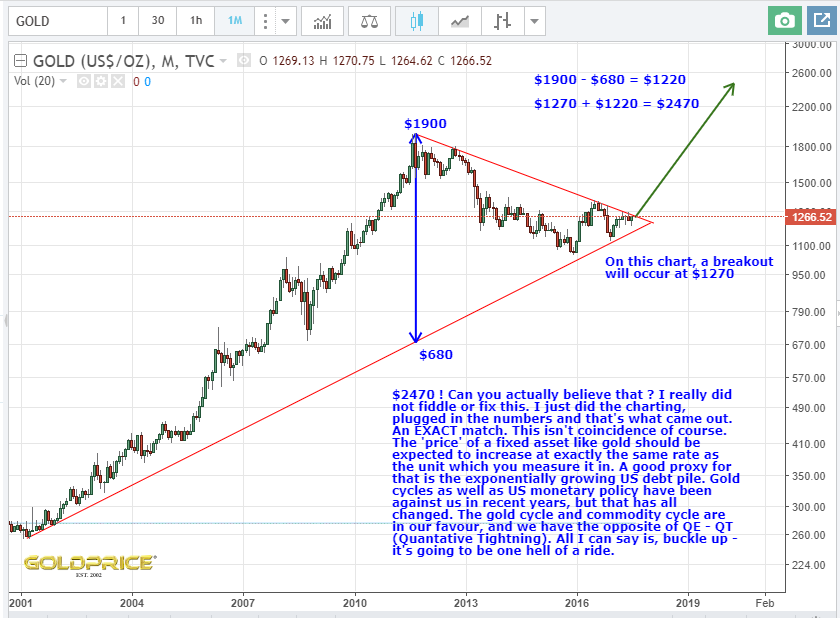
So, if we assume the direction of travel is up, and we discount the ‘parabolic’ $9000 target, where are we going ? I also recently posted in my ‘This Is NOT A Coincidence – $2470 Target For Gold’ that, using simple charting rules we get a target of $2470, which agrees exactly with the apparent gap that’s opened up between gold price and US Federal Government Debt when you overlay them on a graph. The CHF/USD ratio chart is also very strong evidence that PM’s will be moving up.
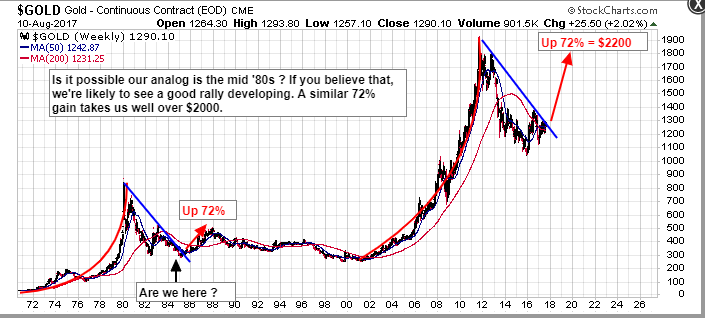
So far, so good. Ken S made a very good point on my post yesterday, and it’s also one I’ve posted before. There is also a case to suggest that we may be seeing gold price behavior similar to the mid 1980’s. At first glance, that might be disappointing, because there was nearly 20 years of ‘sideways’ action. On closer inspection, when price bottomed at $300 in early ’85, it then broke out and climbed 72% in 3 years, to a high of roughly $500.
If we consider $1300 to be a similar breakout today, a 72% move takes us to about $2200. That’s not too far away from my $2470 target. You could apply your 72% move from the $1050 bottom, I suppose, and that would give you roughly $1800. What does it all mean ? What I take away from this is that as we advance toward $2000 we need to be very wary, and alert to what happened back in the 80’s. I happen to believe that we’ll move much higher by the mid 2020’s. Nonetheless, I, for one, will be looking down as well as up, as we move forward.
The other recent charts I referred to as a reminder
The divergence started in 2012. Much of the debt went into equities. Buy backs etc. Not metals.
Plot SGR overlaid with $SPX. Similar divergence, which is abnormal.
History has SGR tracking $SPX, but from 2012 they went in opposite directions.
This will revert. $Silver the next hot market?
Thanks Spock. Very good points. It’s hard to imagine a scenario where Silver doesn’t make impressive gains over the next few years.
Another interesting post Northstar.
I follow the AUD and CHF very closely and the Swiss Franc (CHF) just hosted an ICL or weekly cycle low, while the AUD appears to have just hosted a DCL or daily cycle low in it’s second daily cycle.
With the impending sell off in equities I cannot imagine the diversified miners like BHP and RIO moving higher so I expect the AUD to roll over within this third daily cycle and host an ICL in early November.
The Swiss Franc is much more interesting for gold enthusiasts as it is pointing toward at least the first two daily cycles and maybe the third being quite strong – that is good for gold.
I agree that the set up is very similar to the mid 1980’s and as I follow the 30 year commodity cycle with a mid cycle correction, as well as the 15 year USD cycle, then I consider the 1980’s a great pointer for what may happen over the next few years.
I was a young civil engineer working in the outback of Australia at the time and spent a few months looking at a cost benefit analysis for the original open cut mines called “The Granites” now owned by Newmont Mining and still producing 300+k oz gold annually 30 years later.
The explorers and then producers with whom I was dealing were initially trading on the ASX at less than 20 cents and a few years later were over AU$60 a share.
The point being that despite the less than exciting advance in gold prices the miners made 10 baggers or more.
I am expecting something similar on this occasion. I am not expecting gold to go to the moon but I do think that when gold eventually moves back over US$1550 then the miners will stir and we will see some very good money making opportunities.
Again the 15 year cycle in the USD will see the USD bottom and gold top around 2023 before once again it moves lower into the 2030 cycle low.
I always appreciate your posts.
Very interesting Norvast. Thanks for taking the time to respond. I agree with what you say, and I’m very excited to see how this develops over the next few years.