Silver (SLV etf) – Daily
I really like the chart below for Silver from both an Elliott Wave (EW) and basic chartology standpoint.
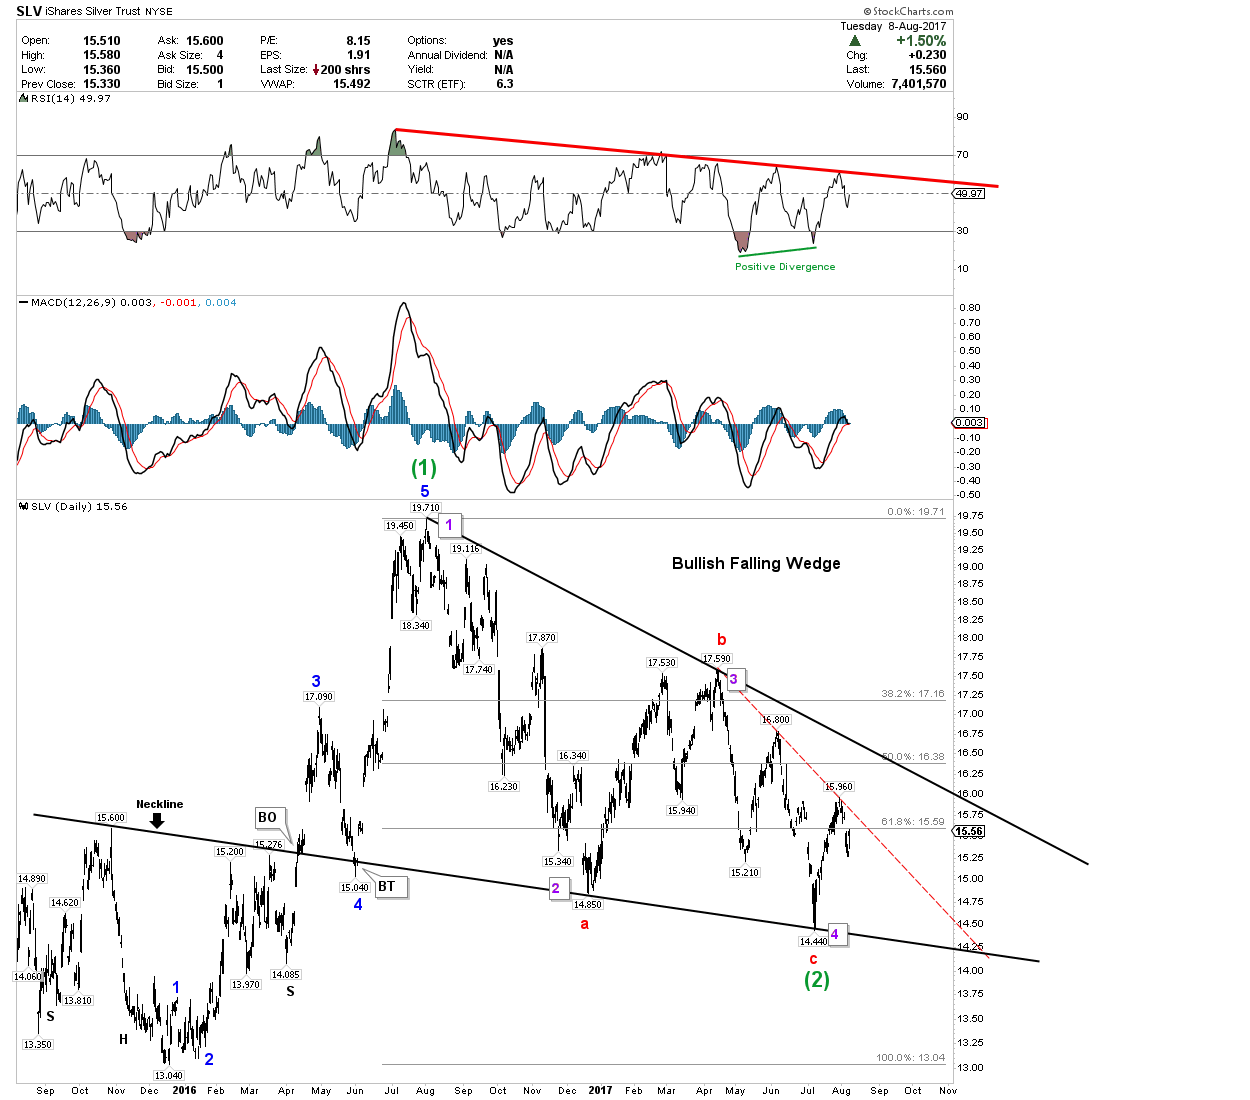
From an EW standpoint, beginning at the market bottom in late 2015, we can observe a minor 5 wave structure (blue numbers) meeting all EW conditions to form a primary (green numbers) wave (1). Primary wave (2)’s may retrace all of wave (1) but cannot fall below the beginning of wave (1). Therefore, primary wave (2) is valid unless SLV trades below $13.04. Otherwise, its on to primary wave (3), which will print another 5-wave structure with a minimum 1.618 (fib) extension target of approximately $26.50.
From a standard, basic charting standpoint, since topping in August of last year, Silver appears to be consolidating within a Bullish Falling Wedge. Note the boxed numbers in purple, representing a valid 4-point “continuation” pattern – the last point touching down at $14.44 and reversing higher. So there isn’t necessarily any reason for SLV to fall back to the bottom rail before at least touching the upper rail first, at about $16.38. It still could, of course – but combined with my EW analysis above, I am leaning towards at least a touch of the upper rail first.
Otherwise, all of the technical conditions are certainly in place for SLV to simply bust right through the upper rail resistance of its wedge formation sooner rather than later – which is actually what I would expect if SLV did indeed complete primary wave (2) at $14.44, and Silver is now embarking upon primary wave (3).
Primary wave (3)’s are typically characterized by explosive or “impulsive” price action and in the present bullish case, upside surprises…
Thanks RTV, the PM sector appears to be turning “sooner” rather than “later”…SILJ is moving to a buy…
Thanks RTV with you on SILJ.