Gold Bull Market? Or was 2016 Just a Gold Bug Mirage?
The consensus view in the precious metals sector is that we have embarked on the next great bull market in gold and silver. The story is gold and the entire mining sector bottomed in early 2016 and launched into its first leg up into early August. The sector then underwent a stiff correction from August to December, and has now finally found its legs and the upward advance has resumed. Money is now flowing into exploration and development plays reflecting the belief in this narrative.
I have an alternative interpretation of the markets action and I would like to share it with you. Intellectual integrity requires me to remain objective and skeptical of the market action since Jan 2016 due to various reasons we will discuss. As an investor I participated in last year’s colossal rally from start to finish, however I am NOT convinced the epic gold bear market which began in 2011 ended in early 2016.
Last year’s rally may have been simply a B wave of an A-B-C correction within the massive bear market that started in 2011. The market uses such moves to relieve internal pressure and to reset psychology. Mr. Market is a deceitful devil and he does not consider us his friend, and uses fakery and tricks to divert us off the trail of success. He employs two diabolical lieutenants to do his dirty work, they are named Mr. Bull and Mr. Bear. Mr. Bear, particularly is a deceitful operator, as he drags market participates down the slope of hope using psychological warfare as his principle tool. Savvy operators who may recognize the trend is still down may attempt to profit by short selling, but Mr. Bear heads them off by squeezing them out of their positions just before the collapse occurs. Mr. Market’s objective is to travel alone to his destination, in so doing he denies you profit in his work. As I said, he is not a nice guy.
If Mr. Market’s ultimate goal is to bring gold and PM stocks to lower levels he needed to pursue different tactics by the fall of 2015. After a 4 year vicious bear market psychology had become universally bearish. Investors were bombed out, there were no more sellers, and for a market to go down it needs sellers. This is where Mr. Market deploys Mr. Bull to reset the psychology of the market. Mr. Bull introduces his tool of the bear market rally (BMR) which draws fresh money back into the market in hope that the bottom is in. Investors acquire a new sense of optimism and lean into the new (false) trend. What this does is refuel the market with new selling power and once the downtrend resumes this new supply powers the market below previous levels. Mr. Bull and Mr. Bear are dutiful soldiers executing Mr. Markets commands achieving his objectives. After a prolonged 4-year bear market, where everyone is universally bearish this process requires more than just a run of the mill BMR, it requires an A-B-C cyclical correction. The question is was the rally of 2016 just the B (up) wave of an A-B-C correction with C ( down) wave to follow.
The Big Picture- the alternative view
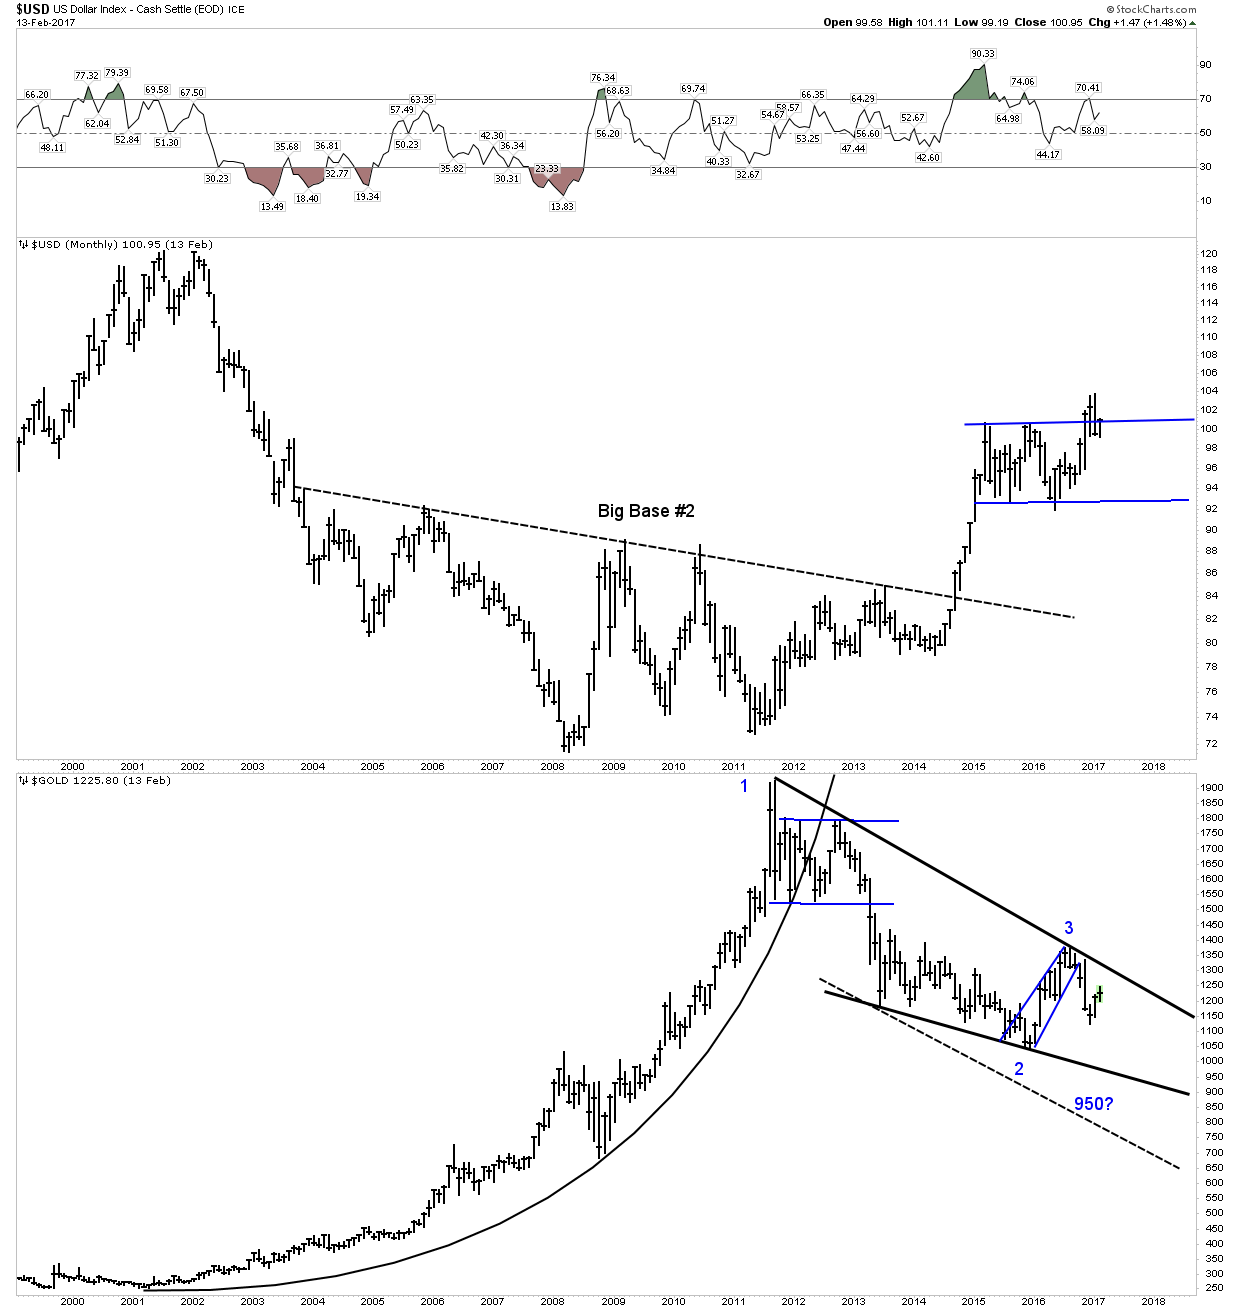
Let’s look at this big picture and explore whether the massive bear market which began in Sept 2011 could actually still be ongoing, which is my alternative view. I don’t really know if the bear ended in 2016, but until gold and the mining stock indexes can exceed the August 2016 highs we must consider , as a possibility , that it has not. The bull market from 2001 to 2011 traced out a 5-wave Elliot bull market pattern. Could the rally of last year just be a B wave of an A-B-C correction within the bear market which started in 2011? I am not convinced either way but I am keeping an open mind. The markers we watch are the lows and highs of 2016. When either of these are exceeded, we will then know the answer.

The Matterhorn
Mr. Market’s diabolical nature often results in him leaving us clues as he travels to his destination. It’s our job to uncover them and determine their meaning. My Matterhorn chart is instructive as it reveals clues while gold attempted to exceed its previous $1309 high of Jan 2015. My interpretation of this attempt is a wonderful example of how Mr. Market uses both of his his Lieutenants to deceive and build false hope among investors. It’s a case of extraordinary deception as he uses classical technical patterns. Here we can see a massive Cup & Handle just under the $1309 breakout level. The Brexit vote then provides the catalyst and breakout volume to drive home the bullish case. Who couldn’t be bullish at this point! But then this rally does what BMRs do… it peters out. This can be seen in the waning money flow and decaying RSI momentum, these are clues Mr. Market left along the way. Price is not able to sustain above the $1309 breakout level and finally gives it up. It’s a clear signal to sell, but the wile lieutenant, Mr. Bear has a trick up his sleeve. Mr. Market has tasked him to drag his victims down the slope of hope so they can deliver the selling fuel down at lower levels where he really needs it if he is to drive the market lower. So when the $1309 level is violated he keeps them in the market using his backtest tool. The price action we see from early October until November 8th, election night is a classic backtest of the $1309 breakout level. This recovering price action serves to keep investors in the market since it inspires hope. In addition, just in case some market operators don’t buy it and go short, expecting a continued decline Mr. Market delivers the coup d’grace, by running the short sellers stops on election night. You can see the squeeze and price volume spike on the chart below. So Mr. Market always gets what he wants, he dragged down and crushed the naive suckers who remained steadfastly bullish and he cleaned out the more sophisticated short sellers, by running their stops intraday just before the collapse. If you don’t think Mr. Market is a demented fellow, you are not paying attention.
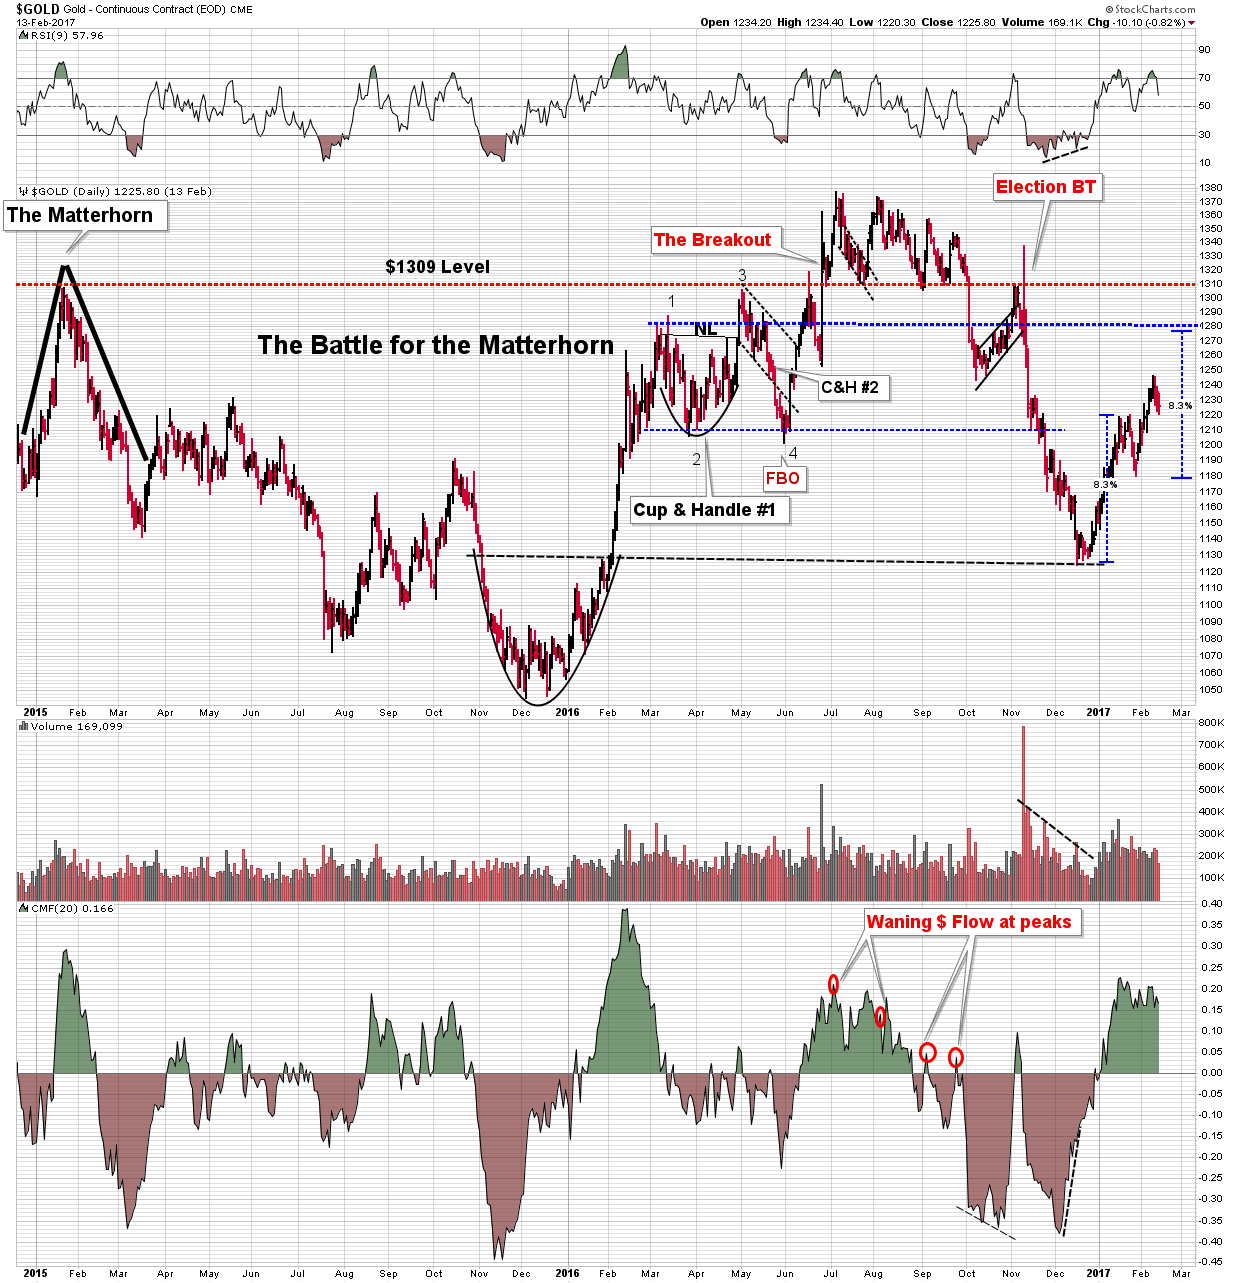
So my alternative view is the 2016 rally was just a BMR which reset market psychology by generating a giant false breakout over the $1309 level, which was the previous high. If the gold price cannot exceed the July 2016 highs its telling us that this entire affair may just have been a gold bug mirage and the current rally may just be a reflex bounce off of previous support of $1120. If this is the case, a likely point which we could observe failure would be the $1280 level or possibly lower.
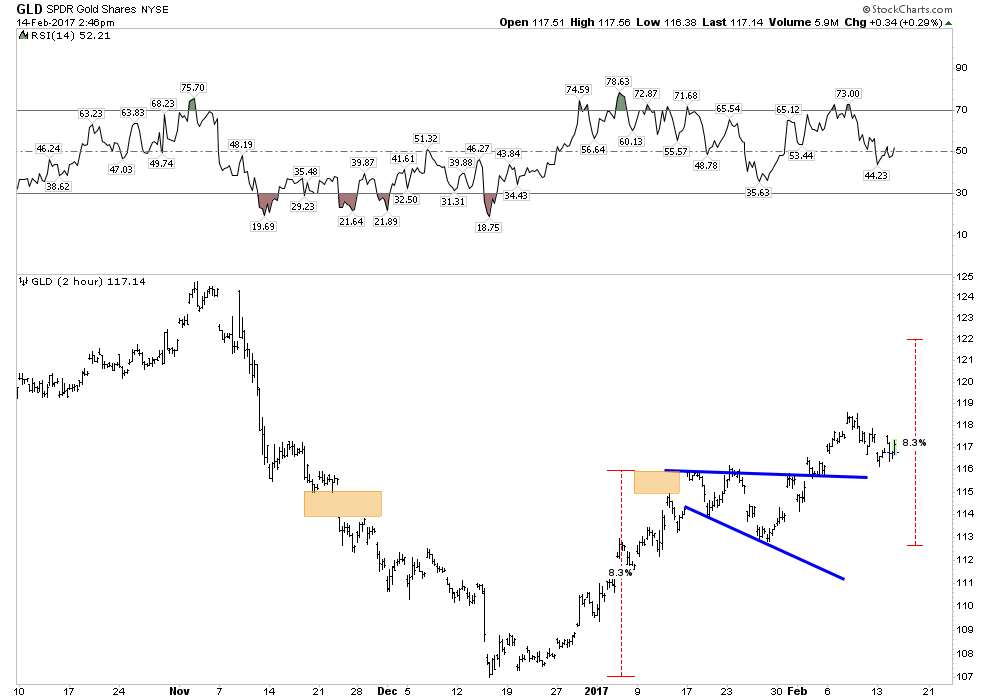
Developing the $1280 Price objective
Other charts point towards the $1280 level as a price objective. Below are 2 charts of the GLD, these are inspired by Rambus' work. The first chart shows an impulse measured move to the GLD 122 price level. This equates to about the $1280 level in the gold price. The second chart shows how this level coincides with the Fib 61.8% rettracement of the entire gold breakdown we saw from July through December. This level would be a powerful backtest.

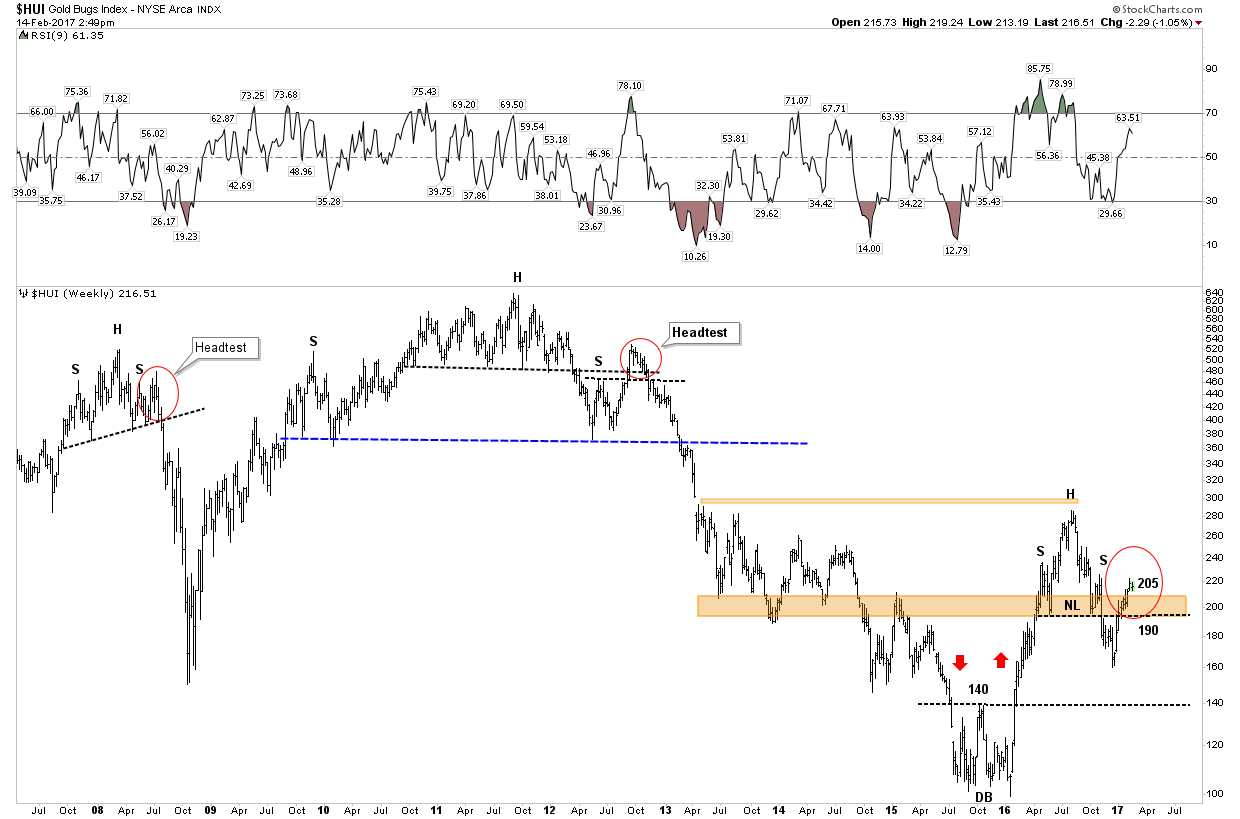
The Headtest
I have developed a principle which I call the headset, which is one of Mr. Bears operating tools. Before a price really collapses it often undergoes a violent upsurge. This upsurge squeezes the shorts and forces them to cover. The market can now fall without the savvy short sellers on board with their trades. Mr. Bear has completed his assignment as Mr. Market can now reach his objective with the fewest operators able to profit. Sounds demented I know, but that’s how Mr. Market likes it, he likes to travel distances without any partners. Sick, I know.
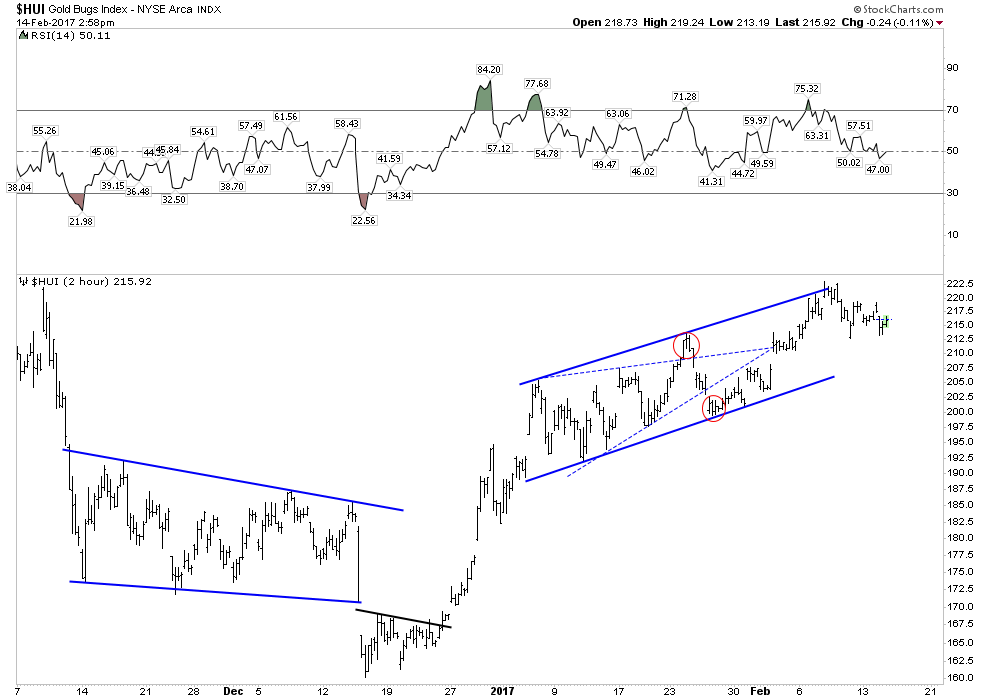
So here are two examples of the headtest in action. Review these then ask yourself, is this what the current rally is – a head test? Note the two red circles Jul 8 2008 and 17 Sep 2012. These head tests served to squeeze out short interest and draw in the skeptical bulls right before a major decline. So one has to beware of a rally on the right side of a H&S it may be a head test.
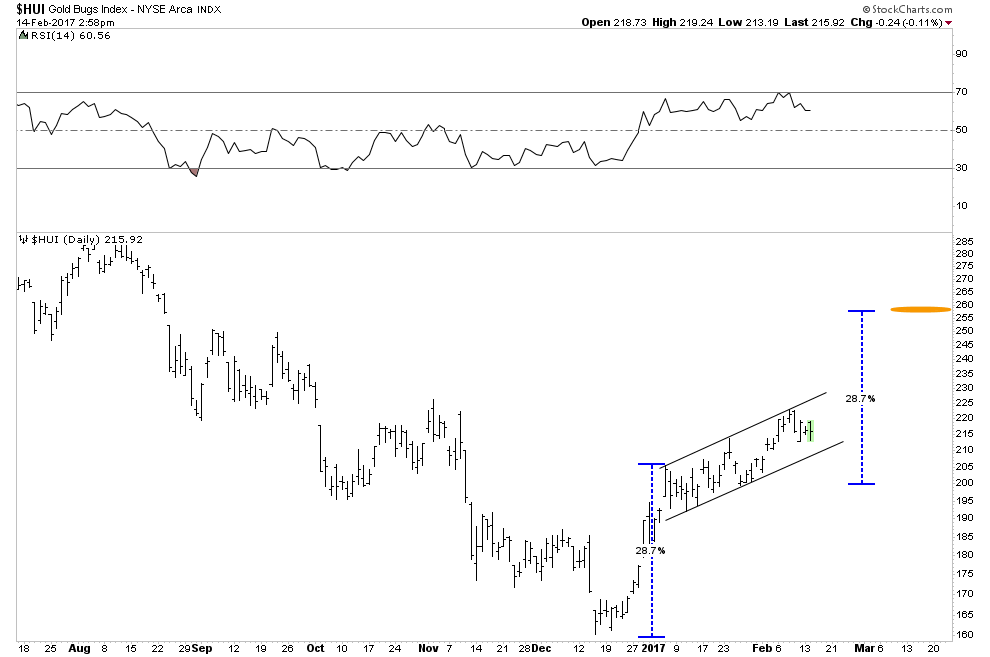
HUI Price Objective
If this current rally fails and the HUI 190 level is violated what could be in store? That grim outcome would point towards an eventual price objective of HUI 130. Its simply a measured move of the rather large sized H&S pattern built out over the past 9 months. If this were to occur the 130 HUI level would be a point to regroup and reassess. It may or may not prove to be a final bottom.
King Dollar and the force
So what’s the force behind all of this, what’s the macro? A post bubble contraction begins after peak credit is achieved on a secular basis. This contraction is the process where economies must delever in order to grow. Credit has reached a level where it impairs growth and must be reduced or reset. This is a long process, normally taking around 20 years. The credit cycle peaked in 2007 and we are now 10 years into the post bubble contraction. This is not a new phenomenon, it is world wide and is the seventh such cycle since the era of modern finance began in the 1600’s. Remnants of this cycle existed even in biblical times, you may be familiar with the year of jubilee.
During the boom years credit is denominated in the world’s senior currency (USD). Extending credit effectively is a synthetic short of the USD. Credit default or actual repayment covers this short, thus bolstering the USD. This dynamic is occurring now and the senior currency is acting as a magnet to capital around the world. The US Dollar strengthens and REAL interest rates are rising. This is not bullish for gold in the early stages as the currency is competition to gold. As the USD rises eventually it caused severe financial implications to marginal economies around the world ultimately leading to turmoil. Once this turmoil reaches a given threshold it will cause a phase shift and act as a tailwind for gold. At this point gold and the USD can rise together. Until then the USD moves opposite to gold.
That’s the macro case depicted in the chart below created by Rambus of Rambus chartology. We can see the USD midway into a major impulse move higher. Its measured price objective is up around 118-120. For the past two years the USD has been consolidating the move out of its base. It is currently finishing up a hard backtest after its recent breakout from that 2-year consolidation. During this backtest gold has been rallying since mid-December. Once the upward move in the USD resumes history indicates it will be bearish for gold, but until then it remains a permissive environment for gold and it can continue its rally. In the chart below we can see that gold will encounter resistance around the $1280 level. Recall that is also my Matterhorn measured move price objective.
A much higher USD, would blow a chilly deflationary wind throughout the world. Ultimately economies would face collapse and central banks would be forced to respond. Their response would likely lite a fire under gold, thus propelling it into a wild bull market.
The Trade
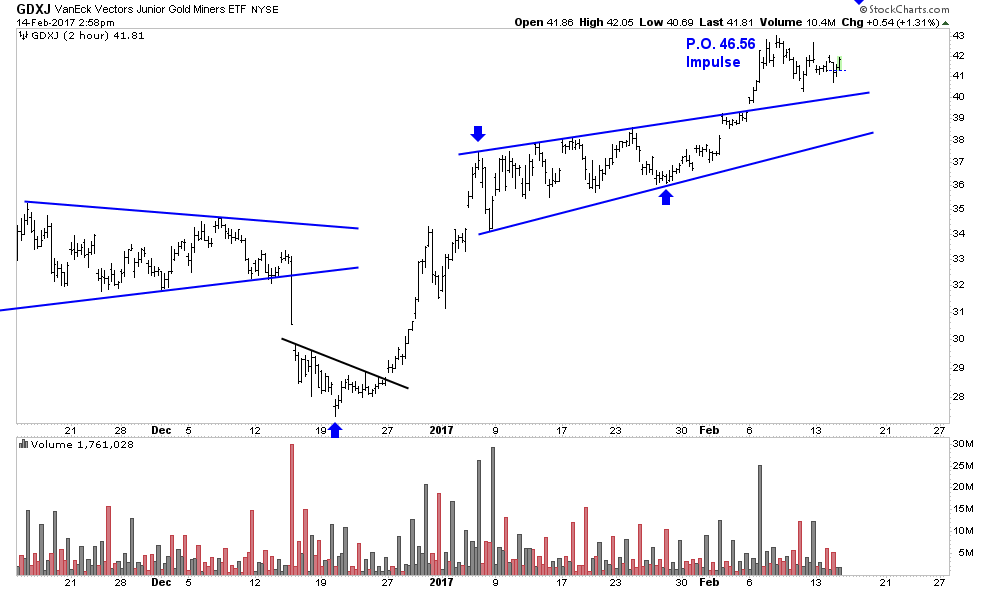
As long as the USD does not resume its upward impulse gold and the stocks can continue to rally. The charts point towards several price objectives which may be achieved within the timeframe of March/April. These price objectives include HUI 255 and GDXJ 46.56. Charts below depict the breakout process where we see the GDXJ as the stronger index.

The perfect bottom-what would it look like?
If the bottom we witnessed in gold and the HUI was not the “real” bottom are there any other clues to indicate this? Apparently yes. The classic gold market bottom scenario typically unfolds as follows: the gold mining stocks form a bottom 3-5 months before the metal finds its bottom. Informed investors sniff out the impending bottom and start to bid up the stocks anticipating a turn in the metal. So the price low comes first in the stocks and the advance is well on its way when the bottom comes in on the metal. That’s a description of the price action, whereas the psychology also tells a descriptive story. Typically the stocks bottom out in a micro burst of selling known as capitulation. At the end of prolonged bear markets the market occasionally goes no bid for up to 3-5 days. This lock-up of liquidity enables a rare dynamic of comical selling. This is where rattled investors simply give up and call their brokers and say SELL IT!. Since there are few bids prices can drop to ridiculous levels, in fact comical levels, hence the term. Illiquid shares dropping 50% intra day just to accommodate a panicked exit.
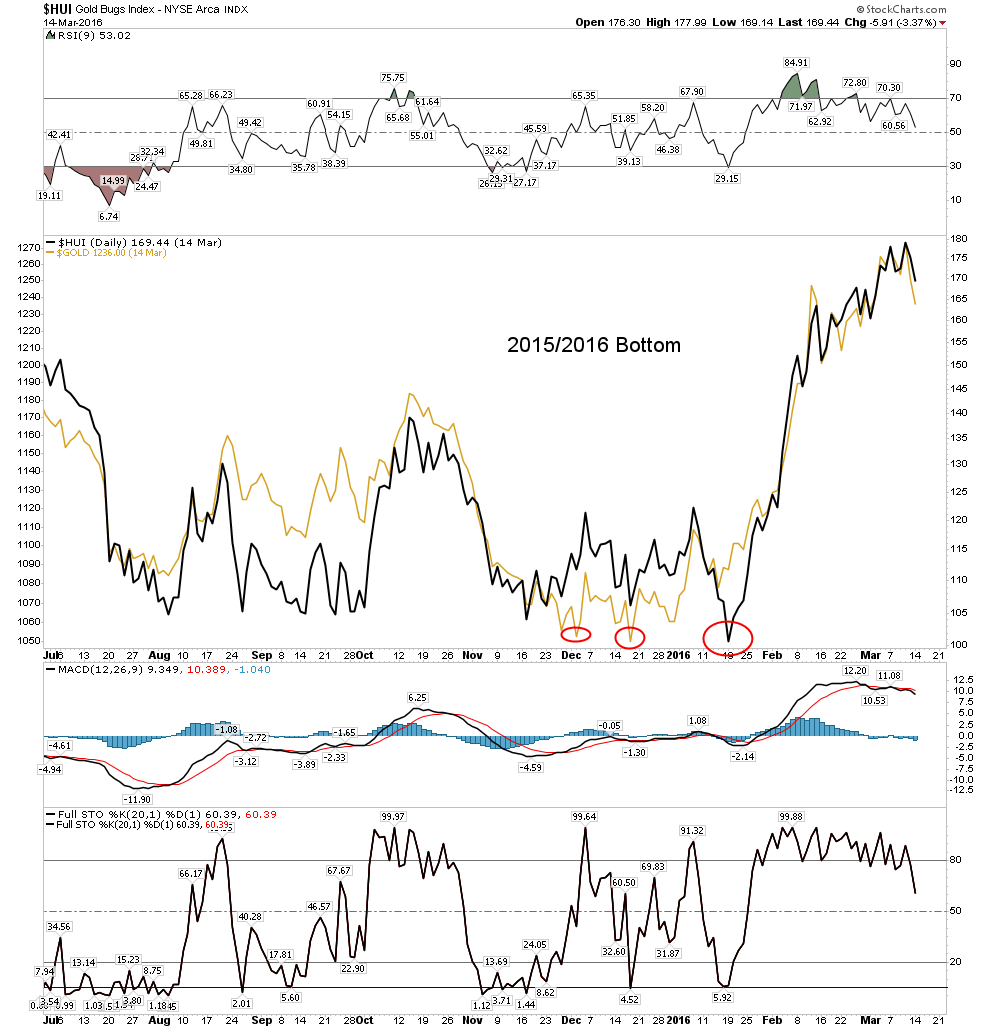
We never witnessed this phenomenon in the Jan 2016 bottom. There is no market law that says we have to, but the fact that we never had the liquidity lock-up and comical selling means we didn’t have that illusive perfect bottom. The bottom of 2016 was somewhat of a mixed bag. What we had was stocks putting in a final low 6 weeks after gold put in its final low. Both asset classes spent about 5 months tracing out a bottom together, but gold made the first move higher. So the classic price sequence was reversed, gold actually bottomed 6 weeks before stocks, plus we never got a capitulation blow out. It remains to be seen whether the massive 2011 bear market which delivered an 80-90% decline finishes with such a knock out punch. The chart below chronicles the bottom and the interplay of gold vs the stocks. Note gold bottomed before the HUI, which is counter to tradition and they both ran essentially in tandem during their bottoming action.
The 2000/2001 bottom- A text book case
When we review the bottom which launched the 10 year bull market from 2001-2011 we see a more traditional “classic” bottom. In fact its pretty much text book. Here we see the stocks putting in a tight double V-shaped bottom caused by cathartic selling. Once the bottom was in the stocks began discounting a turn in the metal. Note this turn came a full 4.5 months before the metal. In fact even though the stocks were well into their rally up 50%, gold still was so unsure of itself that it had to put in a broad based double bottom with the second bottom the lower of the two. This of course set-up a huge positive divergence between the stocks and metal. This was a beautiful text book bottoming sequence.

Conclusion
Until gold and the PM miner indexes either exceed the August highs or violate the 2016 lows no one can say for certain we are in either a bull or bear market. Mr. Market has used his two operatives Mr. Bull and Mr. Bear to sufficiently disguise the markets true hand. We will wait and see what clues we can discover in order to determine how to commit out capital.
Good Luck,
Plunger
Thank you for posting this on the Tent. I saw it first on the Rambus site. As always, your writings give much food for thought.
What I find curious is the apparent contradiction between this piece and the ‘pep talk’ you gave in November 2016 when you wrote:
“I do believe we are in a bull market which started in December 2015 for gold and January 2016 for the stocks. I have written on why I believe this correction of the first leg up has turned so brutal, its likely because the first leg up is early in the 8-year gold cycle so the wind is still in our face. It should swing around and be at our backs by Feb 2017”
As we are in February 2017, we do indeed seem to find that the wind is at our backs right now. Unless I have misunderstood what you now write, I do not see any reconciliation between this statement and your post today. Is it Rambus’s ‘masterful’ chart that has caused you to alter your November ‘belief’ that ‘we are in a bull market’ or rather a simple caution because the market never truly bottomed as you would have liked?
Please do not mistake this for criticism, because it is not. It’s simply trying to understand why you seemingly flipped from a bullish perspective in November (a time of gloom) to quite a bearish stance now, just as the wind is behind us.
Its called discovery. As further facts come in one adjusts ones analysis.
Recall Keynes’ statement when similarly flipped his view:
John Maynard Keynes was an enormously influential economist, but some of his detractors complained that the opinions he expressed tended to change over the years. Once during a high-profile government hearing a critic accused him of being inconsistent, and Keynes reportedly answered with one of the following:
When the facts change, I change my mind. What do you do, sir?
When someone persuades me that I am wrong, I change my mind. What do you do?
Copy that, Capt.
good stuff. Is it not easier to use monthly and quarterly targets for support and resistance along with moving averages for the short term.Just saying as such posts before give great hindsight as turning points.
Guys please dont miss the point The point is …The “Bull” thesis has yet to be proven. Plunger has shown a plausible scenario IF the 2016 Highs are NOT take out AND the 2016 Autumn lows ARE taken out. Whilst we are between those the jury is out. Thanks Plunger…exceptional food for thought. That Rambus Dollar Chart is the elephant in the room that nobody sees.
hard to fight off the greed. 🙁 I myself will follow my mov avg of choice and jump in and out and just live with the missed gains or losses. The dollar will go higher but for how long,also why will it go higher should be the question. Money fleeing Europe and some of that has to get a bid on gold methinks , therefore the 2 can go up at the same time. Why not???? Once charts start showing the planet of golds’ gains of late then that should rise some more eyebrows.
Brilliant. Well thought out analysis. Food for thought. Thanks Plunger.
Thank you for this wonderful, easy to follow , explanation of where we might be and could be and what to be looking for. First rate.
Thanks, Plunger – now I can sleep with one finger on the sell button. Sigh. Price targets are great, though – thanks for such specificity. I know, I know, we have to clear previous highs to confirm a bull. Classic. And right.
Rational and sound analysis. Thanks. Feel NUGT put in a bottom today. Will share charts later…
Read de great bigly article and all great responses. While the wind seems to getting behind us, Rambus’s 975 haunts on until the last ghost of 2011 is completely wiped off.
Excellent analysis as always. I would disagree however with the statement that there is a consensus that the bull is back. I see quite a lot of bearish sentiment out there. In any event, time will tell. These posts are excellent tutorials on markets and much appreciated.
Well among the general public you are no doubt correct, however 2 weeks ago at the Cambridge house convention in Vancouver it was universally bullish. That’s not just cause they are gold bugs as I was there one year ago and it was universally bearish. EVERYONE thought gold was going lower. Including myself, it was pretty amazing in retrospect.
Very interesting, thanks.
Thanks for sharing Plunger,
An excellent note and analysis.
And agree that 1280 is a key, key level.
My question is philosophical, and perhaps practical…
I understand from your note that you personalise Mr. Market as a ‘devil’ whose objective is to travel alone to his destination, using lieutenants to deceive us as to the (longer term) destination – which destination, because Mr. Market is ‘thinking’, can also change from time to time.
That seems reasonable – even correct – to me.
But, when in your mind you personalise Mr. Market, do you mean this in the sense of some immense natural force (such as hurricanes and earthquakes, which might be said to have Mr. Market’like traits and are indeed personalised by humans), or do you perhaps mean some supra human agency (such as has been described in other places as the ‘money power’, the ‘ hidden hand’, et cetera). Or of course, some other interpretation.
I think the distinction important because: as to the first, we might detect its impending presence (e.g. fronts and tremors) – but not really, or practicably the destination; as to the second possibility, being human it’s destination can be logically understood (albeit probably more in this cassituatione via ‘fundamental’ than ‘ technical’ analysis).
Whatever the case – and whatever your response – GOOD LUCK!
Its Simple Really Paul
Mr Market is The Roadrunner and you are Wile E Coyote
🙂
Not bad!
Love it, lol 😉
Mr Market is not a member of the Illuminati nor has he attended any meetings with the Bilderbergs. He may have attended a few AA meetings, but that’s as far as he has gone on a social basis. He is a loner. The concept of Mr. Market is a metaphor, nothing more. I characterize him as dark because so many people who put their faith in him end up either losing money or getting destroyed. They don’t understand his character. They think he is a warm fellow who would like to see you get rich. Maybe people get this from mutual fund brochures or something. But no, he is a ruthless SOB who doesn’t give a hoot about you. Markets are all about test, test, test. Price tests from above and it tests from below. In engineering and fluid dynamics there is a principle called tunneling. Its where water will find a way around….eventually. The dynamics of a market are similar.
If you go sit in a dark room and think about it for a while it may start to make sense. A whole crowd cannot all be successful. There has to be winners and losers. I am not saying its a zero sum game, but its not that far removed from it. A market can’t just go up carrying everyone with it, just as it can’t go down carrying everyone with it. Markets are exceptionally deceptive, I hope I have adequately shown that with my Matterhorn chart. I would be willing to bet virtually all of your professional associates all run with the herd. They listen to CNBC, read the WSJ and may even read Barron’s to form their opinions. They cannot separate themselves too far from the herd as it gets way too uncomfortable for them.. But that’s how the big money is made. You buy something that is thoroughly hated like Northern Dynasty last summer and you sell it when the Barrons crowd arrives. That was yesterday by the way.
Don’t get too hung up about him just remember he is a creep, but I could just as easily used Bozo the clown to characterize him…. would that have been better?
Agreed,
These days I’m a sole trader, and always interested to hear well-informed opinions as to the nature of Mr. Market.
I like your follow-up characterization as akin to the test, test, test of fluid dynamics…. which means, I think, that: all destinations and all routes are possible; and if you are knowledgeable in its dynamics, you may stand a better chance of anticipating the fluid’s destination.
Perhaps this fluid dynamics way of describing Mr. Market also speaks to the importance (or lack) of gaps on charts. At the NEMO science museum in Amsterdam there’s a wonderful exhibit where the children can build dams on a ‘water wall’, with little sand filled, plastic sacks (about the size of a Hollywood sack of gold). There the children (and I) learn that some gaps are more important than others, to the general water flow that is. And also that some support/ resistance is stronger than others…
Those dammed dutchies and their dams, eh!
This is a museumic master piece. Together with most responses, it is a must for higher academic delivery on investment esp the $.
Unlike other markets, the US has most investment instruments that interlink gold but, really the driver is $ till it’s global status is challenged. With the coming death of the nearest challenger ie €, it’s going to be ultra difficult for $ to succumb. It will take a very long while for SDR to fight off $, esp when war zones aren’t cooling.
Wow Plunger! I have never enjoyed reading until last April when a friend turned me on to the Tent and Spocks site. For the first time in my life, I truly feel Im right where I need to be. Among the best in the business. I have been fortunate over my years to have been surrounded by some of the best in different industries and here I have it again. Every contributor here and their willingness to propose alternative views is what gives this site the value and strength that it has. Its easy to take a site like this or Spock’s for granted at times when things appear to be going good, being caught up in the excitement of seeking out the next valued investment. The priceless teachings and perspectives combined with team collaboration make this and Spock’s the two greatest schools I’ve ever seen. This piece is a perfect example. I wouldn’t trade it for a dozen Harvard educations. I appreciate the much needed alternative view in an easy to comprehend narrative. This kind of stuff is addictive. I will be printing a copy for my travel bag as a reminding perspective of the beast were dealing with.
It certainly is a beast. And it can turn on a dime and crush you in a second. Look at Northern Dynasty today. Just putting out a current view as I understand it. Its a bit frustrating when members come back 6 months later and say you were wrong wrong wrong. Hey, I never said I was right, just trying to grow by sharing my thoughts. I will guarantee one thing however, you are not going to get this take in Barrons or even various gold bug newsletters,
Best.
Welcome back to the PM bear tent.
But as much as it surprised me when you changed course in favor of a New Bull last spring, I think you’re off on this call as well. FOR NOW.
Conceptually, I believe you’re on the right track, as you are following my long standing EW thesis — which you got an early read on. Which Fully sent to you back in 2014 because it meshed with YOUR views that I had stumbled on at the same time. We retrace to 1970.
So I do agree on the ABC. But the market likes symmetry and 5yrs for A, and 6mos for B doesn’t supply that.
So to limit the risk of having to reverse course again, I’m going to argue that B up isn’t done. Not close, in time or price.
But I don’t have a crystal ball either, so where we are in B up as of RIGHT NOW is still uncertain to me at this point. We should have a clearer sense in 2-3mos. I’m looking at a correction now, but likely higher into a rebound top for next month. Then down again. How far is not clear.
Then we get a real bond market rally by summer So — small down, small up, reverse down hard to finish b of B. Then c of B up to 1500 on dollar issues. Then the euro implodes next year, kicking off C down into 2023.
Again Pedro….I don’t make calls. I discuss possibilities.
I don’t think the bond market bull is dead yet. But that’s a whole other discussion which can get real scary.
And as far as getting bullish last winter 3 weeks after the bottom. I sure don’t regret it. Doubling ones portfolio in a year helps mitigate the pain of being “wrong”
https://goldtadise.com/?p=394554
Watching 1500 till next revision.
However the 50% level is 1443-1483. Andrew McElroy’s earlier article on SA had suggested that on an analogue to argue gold could be doing an early B.
Also 2001-2011 had 1042-1087 for 50% that failing to break is bullish.
Thank you Plunger for the reality check. All one can do is watch what Mr. Market provides us with and invest accordingly. I personally watch and analysis my portfolio daily and look for sentiment changes while knowing the fundamentals inside and out. It is all about gaining an edge. I do need to learn more about money management as I know this is an area that I am vulnerable. Learning to trade is an ongoing endeavor that needs to be constantly honed.
When you say money management, I assume you mean position sizing? Today was an object lesson on stop loss discipline and position sizing. Reference Northern Dynasty (NAK)
Wonderful analysis, thank you providing excellent article on the psychology of Mr Market.
Alternate to day to day geometry.