Simplicity
Where’s the dollar going ? What about the Yen ? Interest rates ? Government policy ? The EU ? Brexit ? Commodity cycles ? All very interesting and adds to the ‘weight of evidence’, but simple moving average convergence divergences speak volumes. The triple exponential average (TRIX) also confirms coming moves by tracking overbought/oversold conditions and values rising above zero indicate upward momentum (just starting to turn upwards now). A chart speaks a thousand words so here you go. The first one looks at the bull years 2001-2008, and the second one looks at the bear following the 2011 top and current price action.
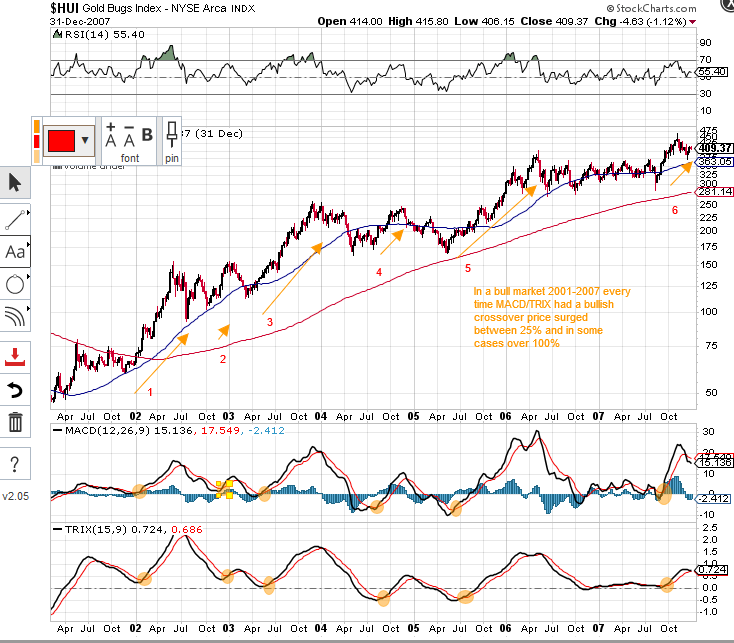

No matter how hard I try, I just can’t see anything in these charts except BULL.
nice stuff , dollar and gold up together again! mmmmm must be big trouble brewing out there. Will gold correct with the dow ????
Gold tends to perform well during times of uncertainty (measured against FIAT paper, or should I say toilet paper, lol). That being the case, our very uncertain world with pressures and tensions cropping up daily should push gold and silver much higher. In ’08 the markets tanked and dragged PM’s with them in a sudden sell off to maintain liquidity. I think this time around it may well be more of a ‘re-allocation of assets’. As it becomes apparent that the markets are in trouble, safe havens should do well because they are not currently at all time highs, and should therefore see good gains. All just my opinion of course
Love it Northstar. Thank you for sharing.
No probs Saab. I tend to try to focus on simple trend indicators which fluctuate on a timescale of months – sometimes taking profits when I sense a top, and buying back in somewhere near the bottom. I did that by selling most of my PM shares in Sept/Oct and getting back in just before Christmas. It can give you a few sleepless nights and the first time I tried it, I ended up buying back at a higher level (which is ok in a bull market). The way I see it at the moment, we have at least 2 or 3 months of rising PM’s before the next breather/correction (which will be shown by a bearish MACD/TRIX crossover).