HUI Daily
Here is how this chart looks as of Fridays action
IMHO this is a very important line ( Neckline of Doom)
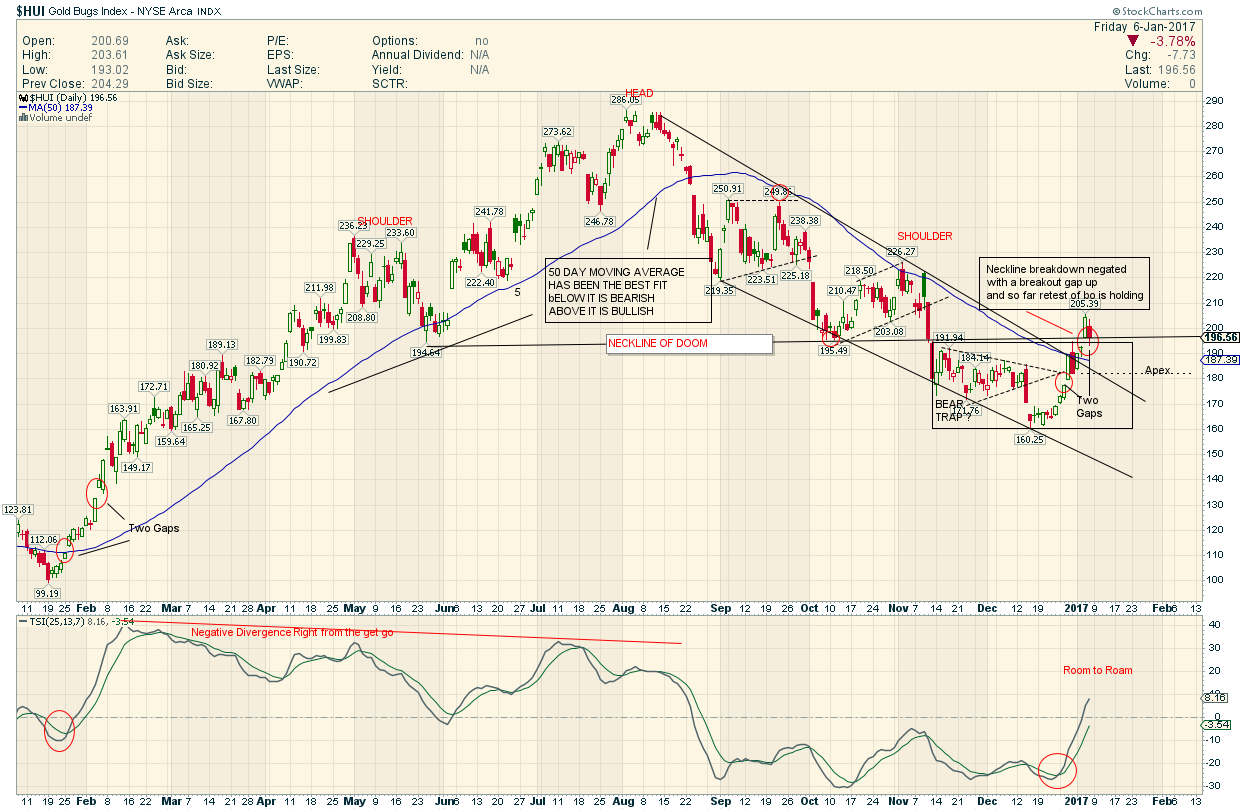
IF the neckline holds now this is Very Bullish as we would have seen a FBO ( false breakout ) otherwise known as a Bear Trap !
IF the neckline is breached again to the downside this is Very Bearish as we would categorize this action as a STRONG retest of this neckline from below which has ultimately Held Resistance ( strong meaning the price pierced the neckline briefly but failed)
To follow this chart here is the link ( you may need a Stockcharts subscription …not sure)
https://stockcharts.com/h-sc/ui?s=%24HUI&p=D&yr=1&mn=0&dy=0&id=p55373306149&a=497643882
UPDATE:
here is a summary of what this chart is implying:
1…Above 195 = Bullish
2…195 to 187 = Neutral and Watching Like a Hawk ( or more like an Eagle  )
)
3…187 ( this is the 50DMA to 182 ( apex support) = Neutral (with finger on the Sell Button)
4…Below 182 = Bearish
Great chart. Will be watching this very closely. Thanks.
I can see a more encouraging neckline at 160. It gives you broader shoulders and does not get breached. That’s just the optimist in me looking for a brighter side.
TRADER KNOW THYSELF
Noted. Too much optimism is a great way to lose money.
Can’t decide if I’d be more excited to see the HUI skyrocket from here or break down again. I could always use another big dump to improve my positions. Then again, it’s always nice to see your account going up sooner rather than later. If we do break down again, I was thinking of buying some First Majestic Silver shares. That stock is almost like buying NUGT but without the decay.
Gold on day 14 and the Miners on day 11. This may be the first Trading Cycle top out of the YCL but this is about where we sometimes see a half cycle Trading Cycle low. I do expect a bounce next week but will it be a higher high or lower high, that is the question.
Time will Tell…
Thanks FGC.