Hello, I’m New to this Site
Although I’ve been studying chart patterns for almost forty years I find the work of friends who’re true professionals to be of great help at major inflection points in most markets. One such article is posted below. Hope you find this helpful!
************* ************* *************
GOLD: Different This Time Around?
October 25, 2016
Since early 1993 we have tracked the weekly Commodity Futures Trading Commission’s Commitment of Traders report which is released at 3:30 pm on Friday afternoon. The CFTC report is available online and reflects data as Tuesday’s close, 3 days earlier. When we started this process we made a decision to focus on the Net Commercial position in approximately 36 markets maintaining this statistic on accounting ledgers. It is time consuming but over the years, in different markets, certain tendencies will occasionally repeat which have proven to be insightful.
As an example, in the corn market, prior to the time when positions limits were expanded, the absolute magnitude of the net commercial position was an excellent leading indication of an approaching price high or low which normally coincided with the seasonal high or low.
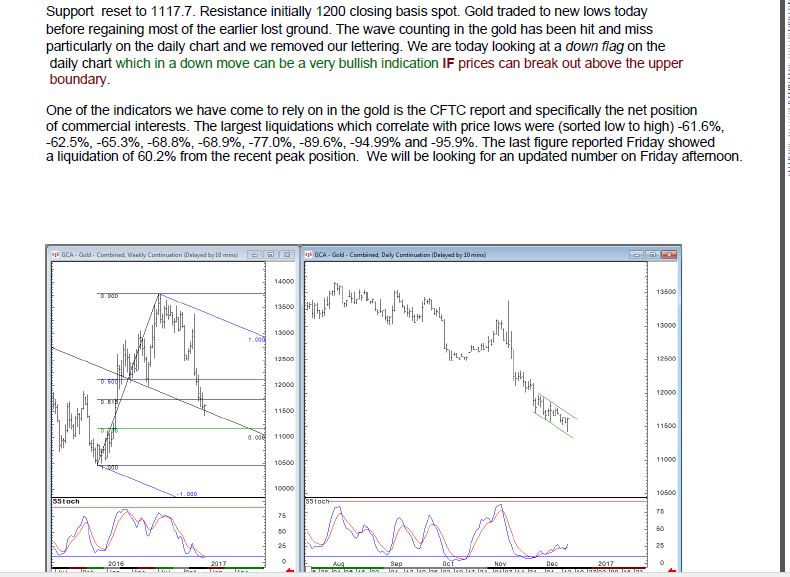
In the gold market, one of the interesting facets we see periodically is the growth of the net short position during a large price rally and then the subsequent liquidation during the price decline which follows. The greater value however from our perspective has been the relative magnitude of major liquidations which coincides with important price lows.
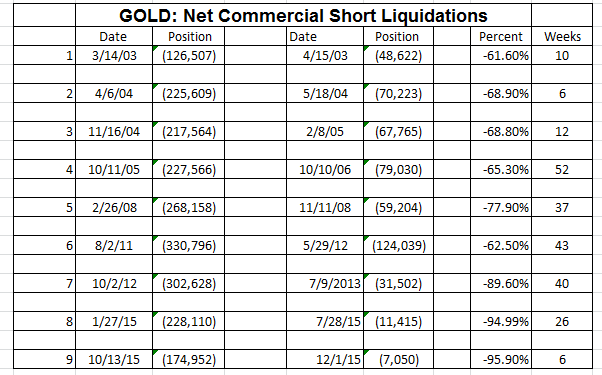
Utilizing futures data for the first 6 months or so in 1998 and then shifting to futures and options, we have identified 9 liquidations which in percentage terms were extraordinary.
Before we illustrate our findings let’s explain what we did and more importantly what we did not do. We did NOT start from a major price high and note the magnitude of the net commercial position and then what that position was at the following price low. We simply looked at the extreme values of the commercial position and then proceeded to note on the weekly charts where those (CFTC) extremes occurred. The statistical data is on the following page in a spreadsheet format.
The standout statistic is the percentage decline indicative of a major liquidation. Not all price lows or many price lows will be preceded by a large net commercial liquidation, but, all major liquidations in the net commercial position appear to coincide with an important price low. Surprisingly, some of the observations required a great many weeks to complete and others relatively few.
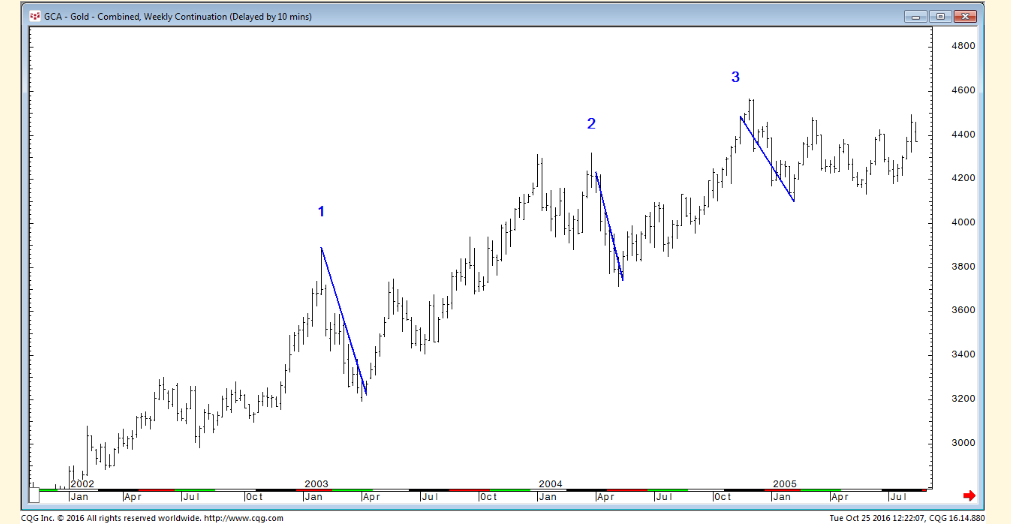
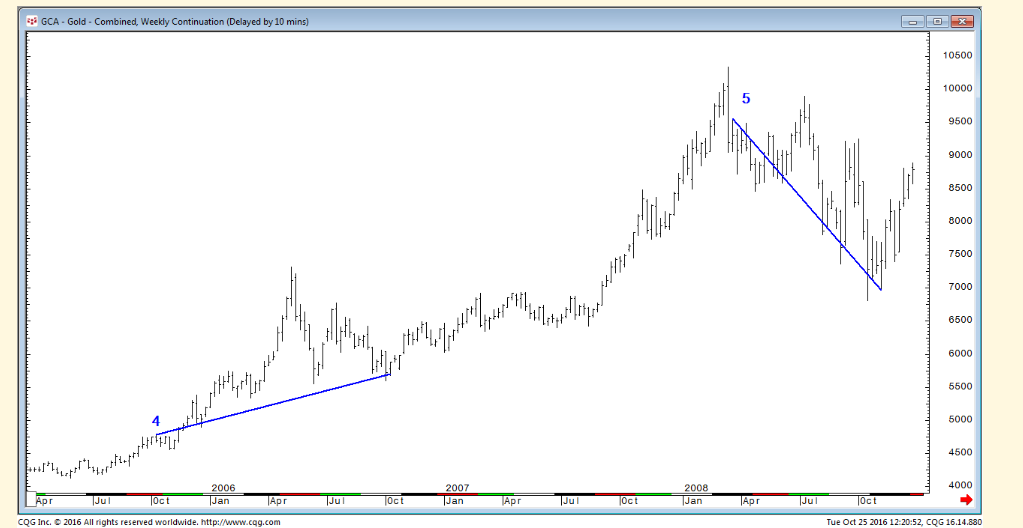
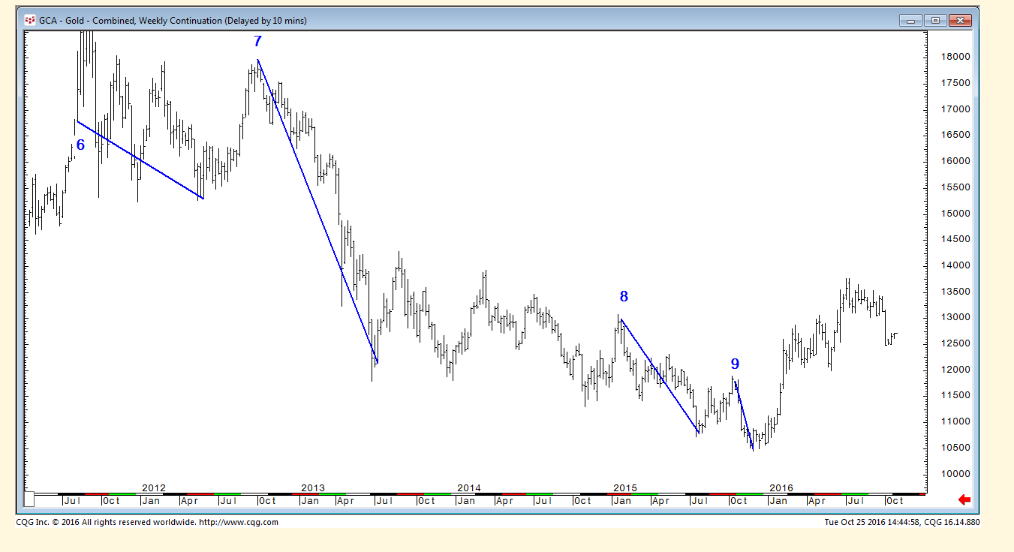
Following the spread sheet we illustrate on a weekly gold futures chart where in time the extreme values in the net commercial position occurred and with a blue line, the duration of the liquidation. Each of our 9 observations is references on the weekly charts. All the position data on the spreadsheet below is in parenthesis indicating net short or negative result when subtracting the short positions from the long positions.
Here is an update from 1 week ago regarding the COT situation
Regards
Boobooman
Boobooman ! Why ?
Welcome to Goldtent, thanks for the insightful look at the COTs
My wife and I are rescuers of homeless or abused canines, mostly terriers. We have four at present and a small cemetery on our homestead with nine of them buried there.
Years ago I began calling them “boo-boo dogs” and my wife then called me the “Boo-Boo Man”.
That’s where the name comes from. (Silly, isn’t it?)
Fantastic is what it is. Its a pleasure to meet you Boobooman !
Thanks Boobooman,
Very interesting indeed.
I’m having trouble posting images and FullGoldCrown has been most kind in helping me.
There’s a spreadsheet showing Net Commercial Short Liquidations in Gold that gives meaning to the entire article.
Fully wasn’t able to post this because I loaded it as a docx instead of a bitmap or jpeg.
I’ve reloaded the image correctly and hopefully he’ll post it soon.
I plan to spend some time learning how to do this correctly so I won’t be such a burden to this nice man.
Not silly at all. Thanks for posting.
Thanks for that very interesting article! Pray, tell, BooBooMan, from what country doth thou hail-? Enchanted d’avoid fait votre connaissance!
The United States.
(Well, we once were, but now we’re the very Divided States.)