GDX Daily and 60 Minute…
Let’s face it, always a bear and bull case in every chart…
I look at the minute charts for clues which can eventually transfer to the larger charts…
As we all know, the daily is still bearish, with a trend line breached yesterday…
DUST did not have enough bullish momentum today to make me a complacent bear; thus the daily spinning top or candle of indecision on the daily GDX
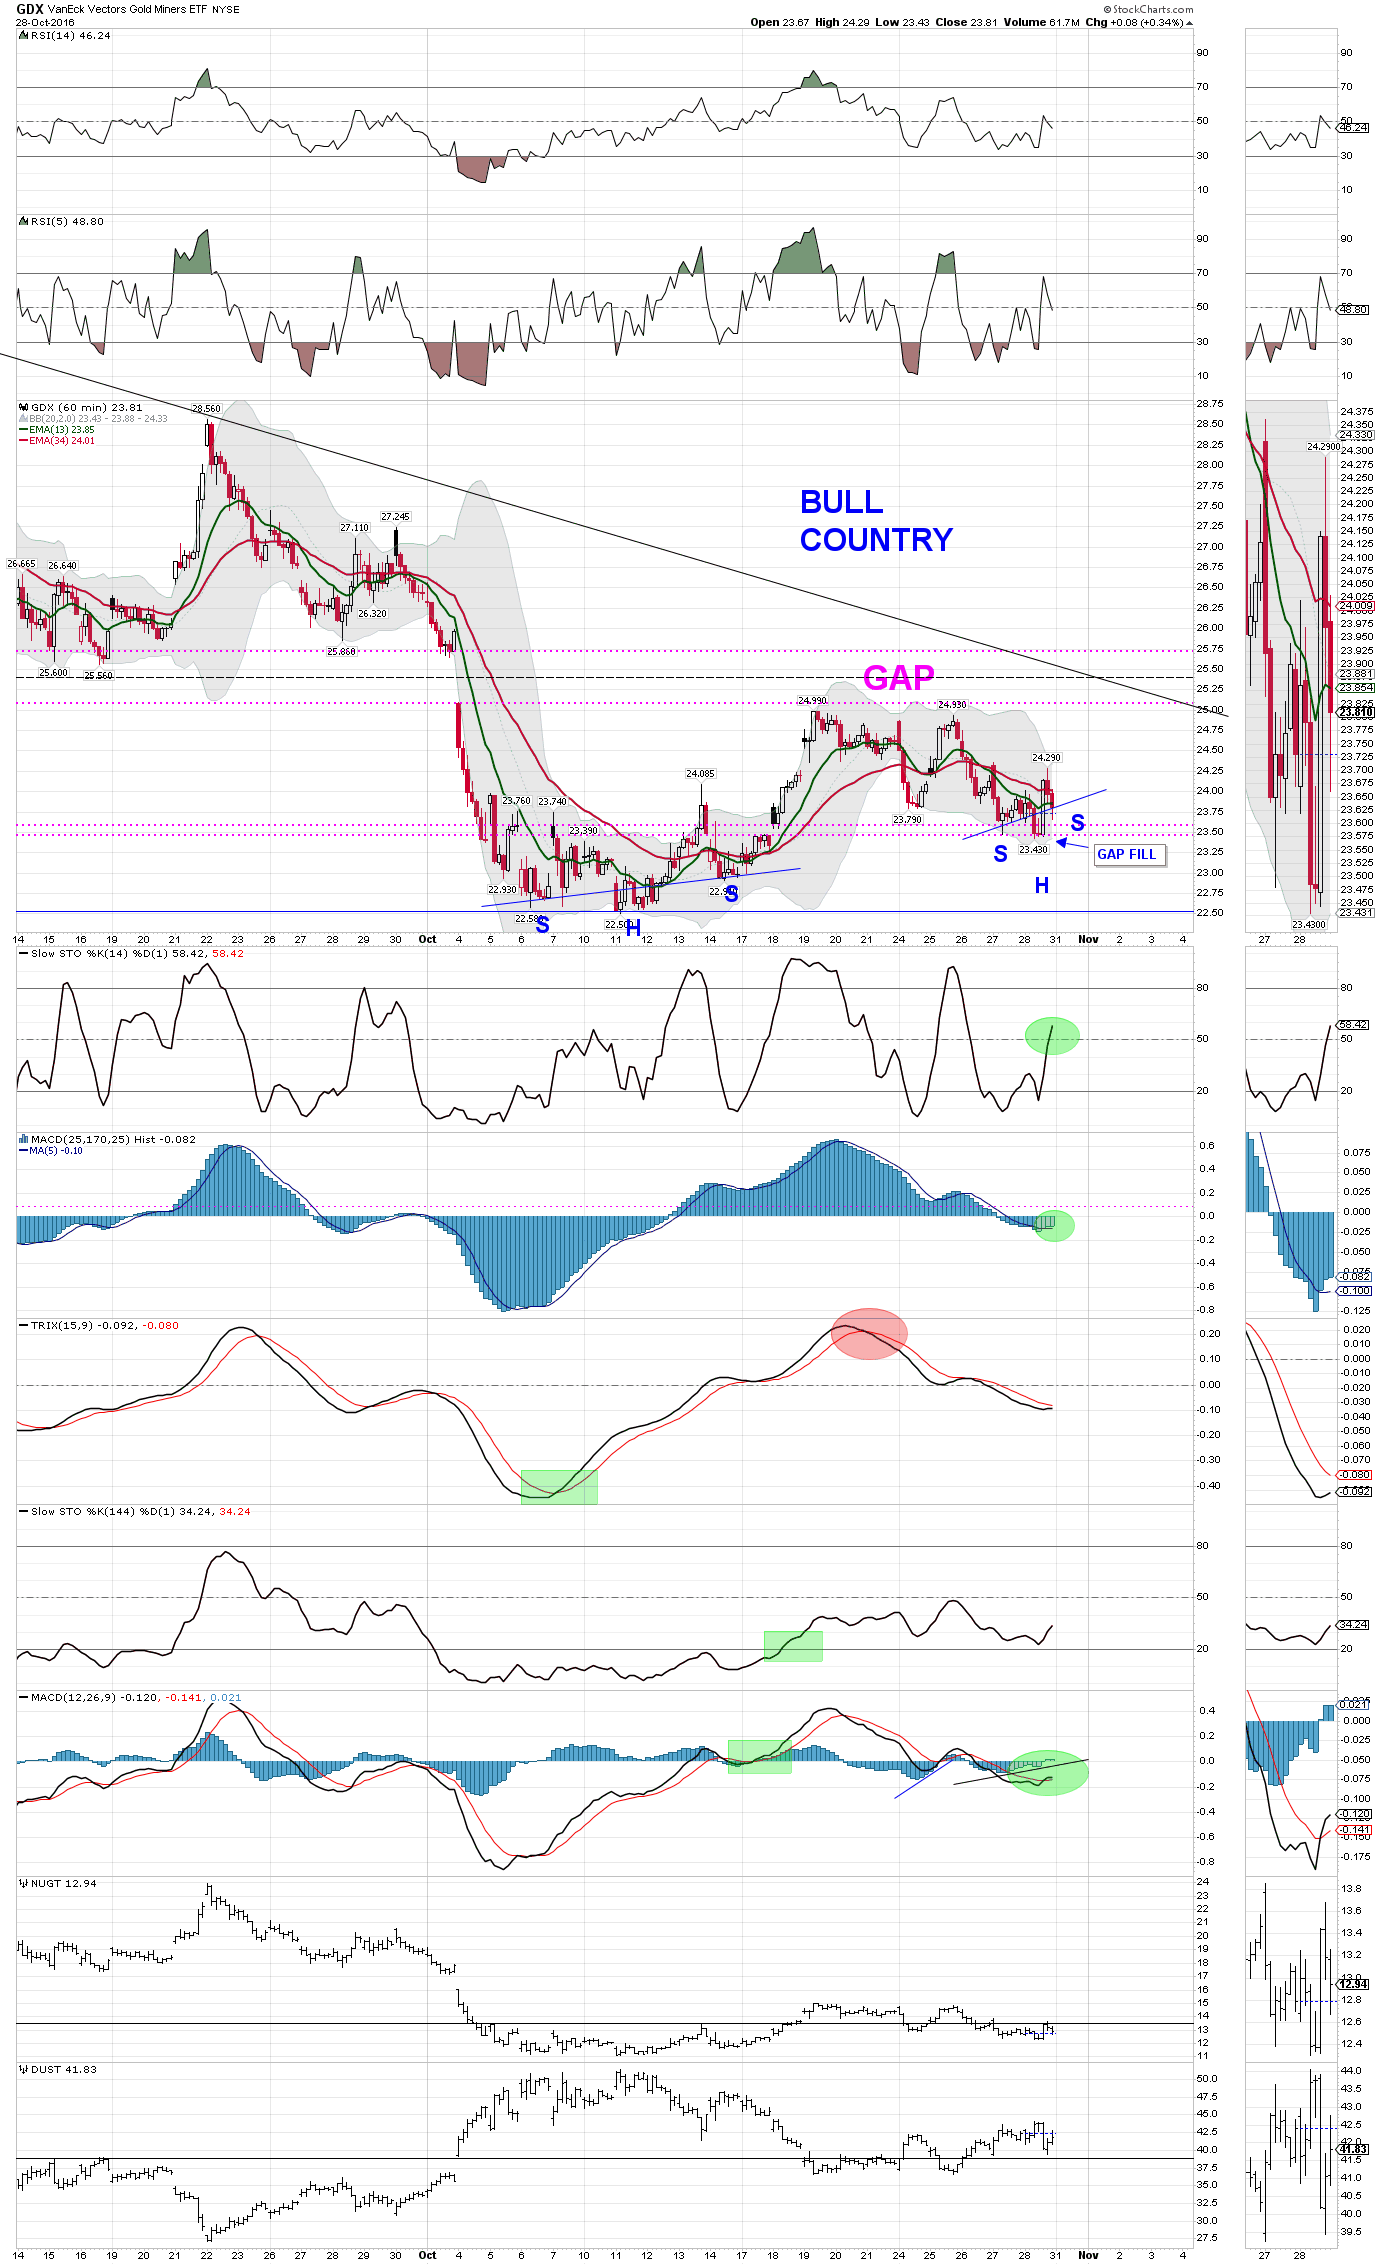
The TRIX trend line has been breached FWIW…Still need more bullish action on the MACD histogram to give this signal more strength…
GDX daily…
I am watching the RSI 5 bounce with great interest, the most sensitive of the indicators…
Recently starting using the slope 20 indicator to cut through the noise, breaching 0 is bullish…
Added a potential pole/bull flag annotation to chart…
Again, the slope 20 breaching 0 and the RSI 5 bouncing could indicate the start of another pole formation…
This could be the FIRST pole/flag formation with many more to come IF the diagonal trend line is breached entering “bull country”…

GDX 60 with a mini inverse head and shoulders?
A potential inverse head and shoulders at gap fill is bullish in my book…
In summation, we still need more evidence IMHO for both the bear and bull case…
Rest easy Goldtenters, we have next week…
Thank you Eagle for all your posts and thanks to every bull/bear who donates their hard well thought out work for us lurkers .. that helps keep us in the game ..
Amen to that JJ. ES is prolific in his terrific contributions to this board.
Lots of wisdom in your commentary. Always appreciated and I always take notice. Cheers
Thanks guys, do not go long with this scenario; just keep this in the back of your head…