Chartology of the Mining Indices and Stocks : Bullish or Bearish ?
HUI
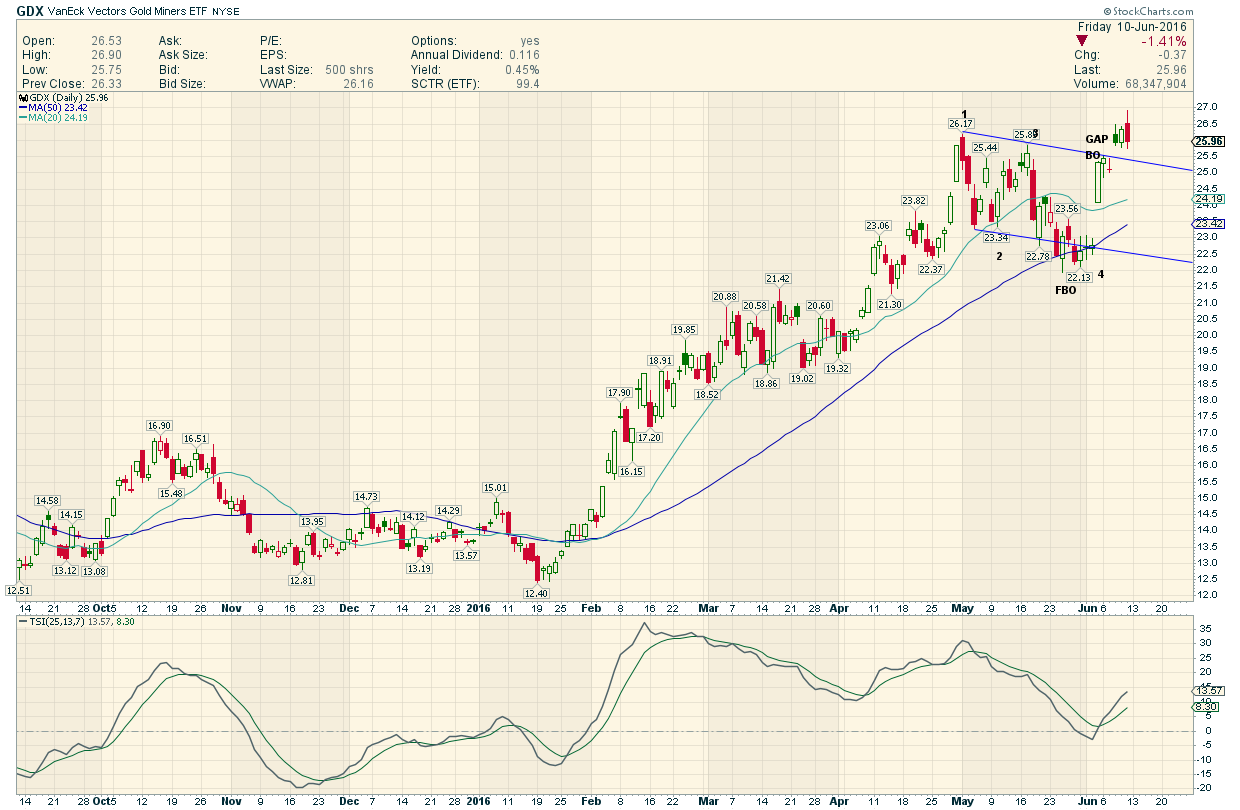
GDX
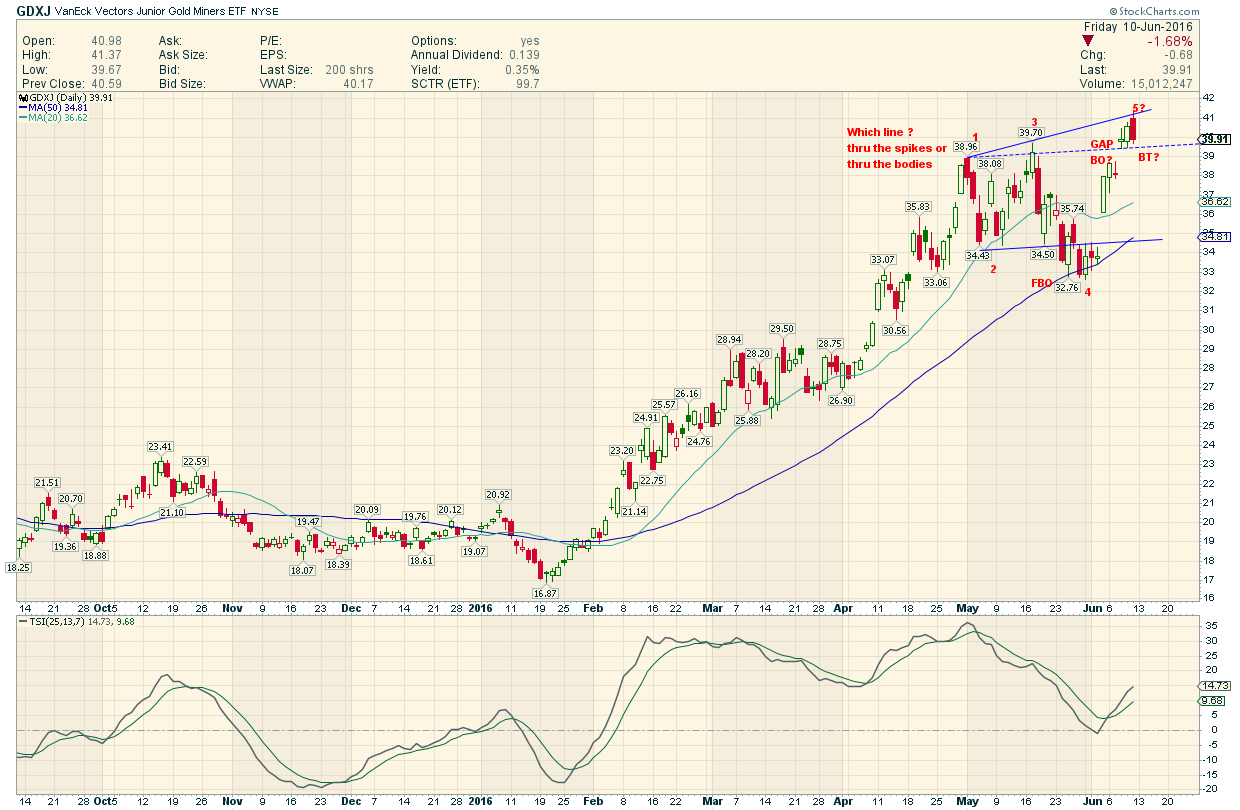
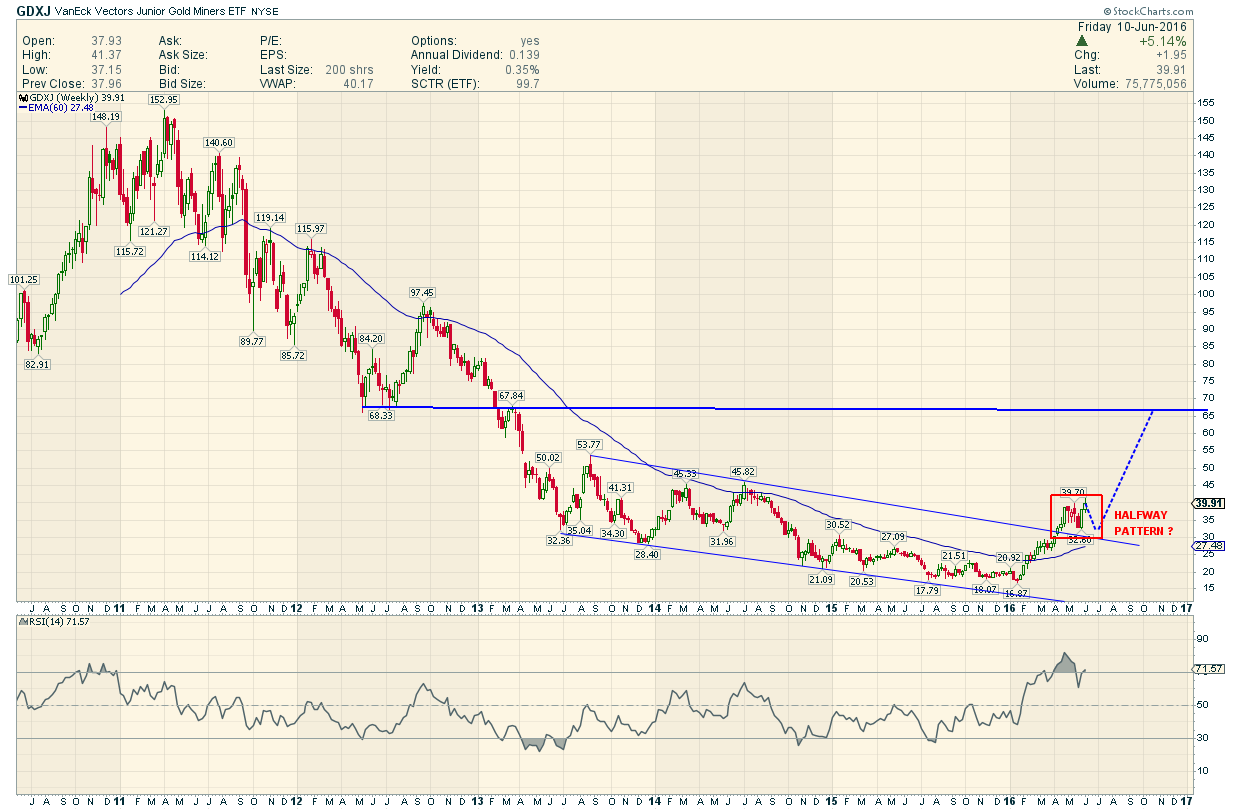
GDXJ
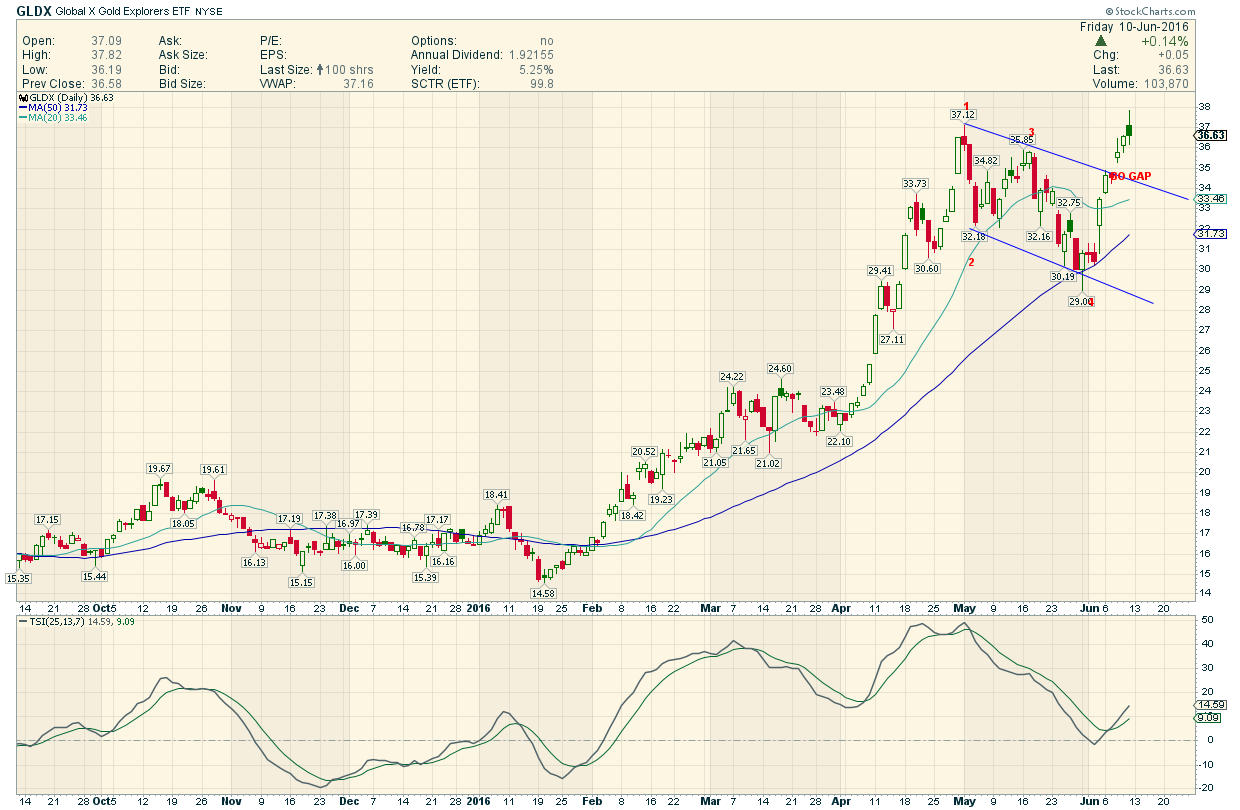
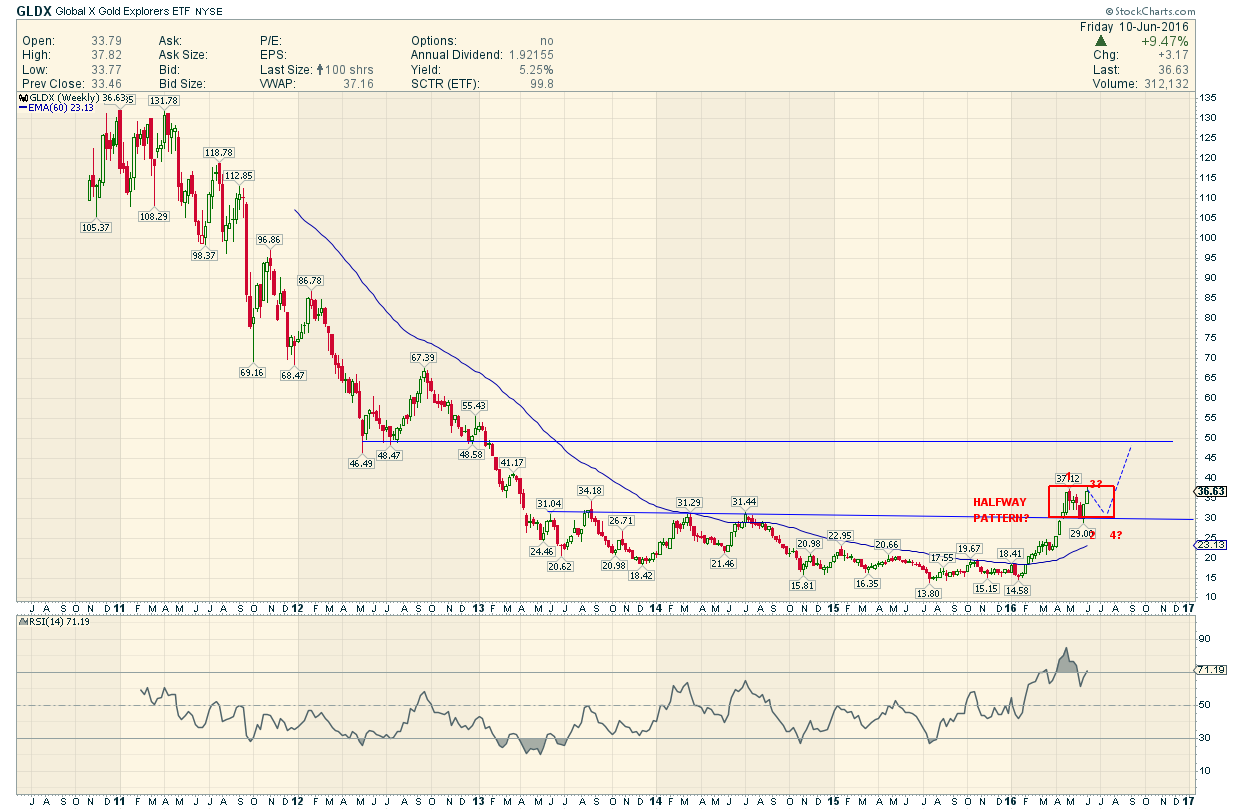
GLDX
………………………………………………
Analysis of the 4 PM Indices
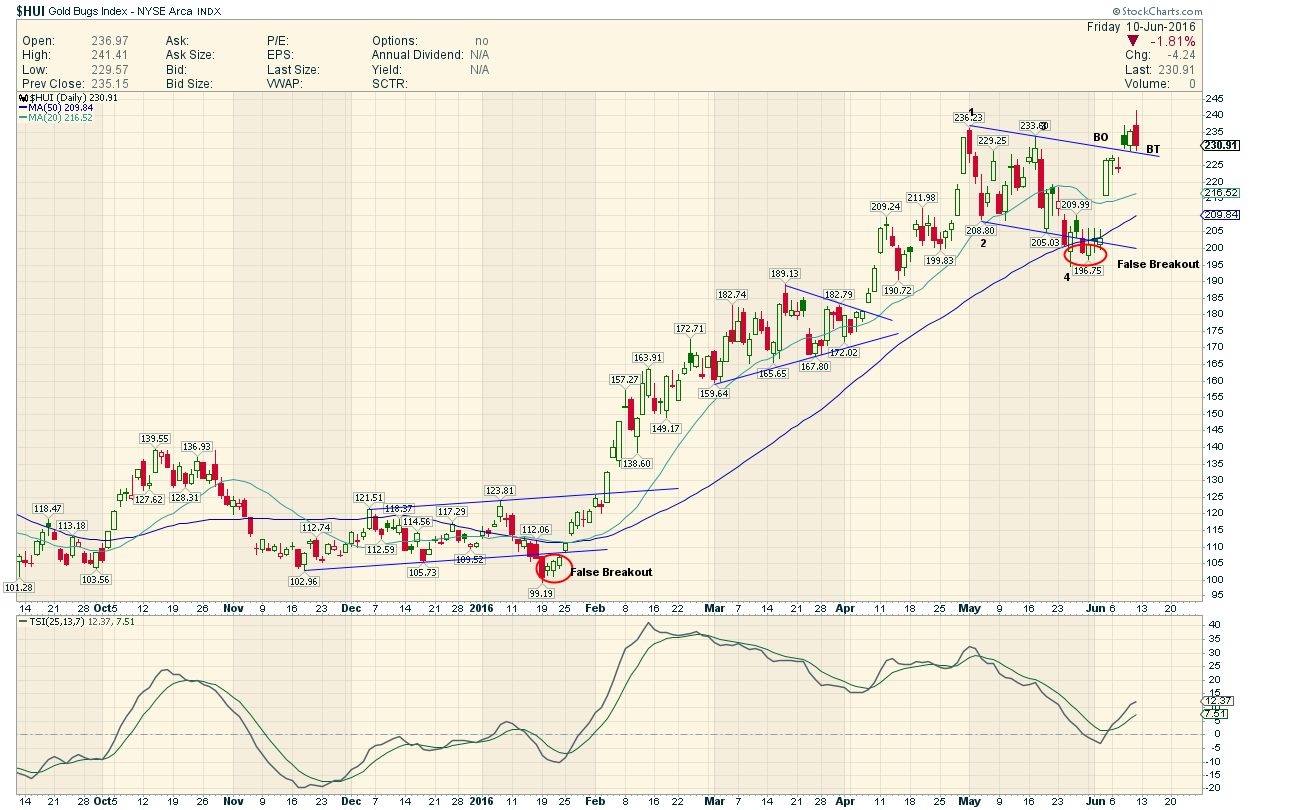
Daily:
…all have broken out of a 4 point Bullish Pattern with Gaps after false breakdowns
And are retesting . These..from a Chartology Perspective are Very Bullish Daily Charts as long as the breakout lines hold
Exception…GLDX has not even begun to retest
Possible exception…GDXJ has 2 possible top lines and is either testing the top (using the candle wicks)
or has broken out and retesting from above ( using the candle bodies)
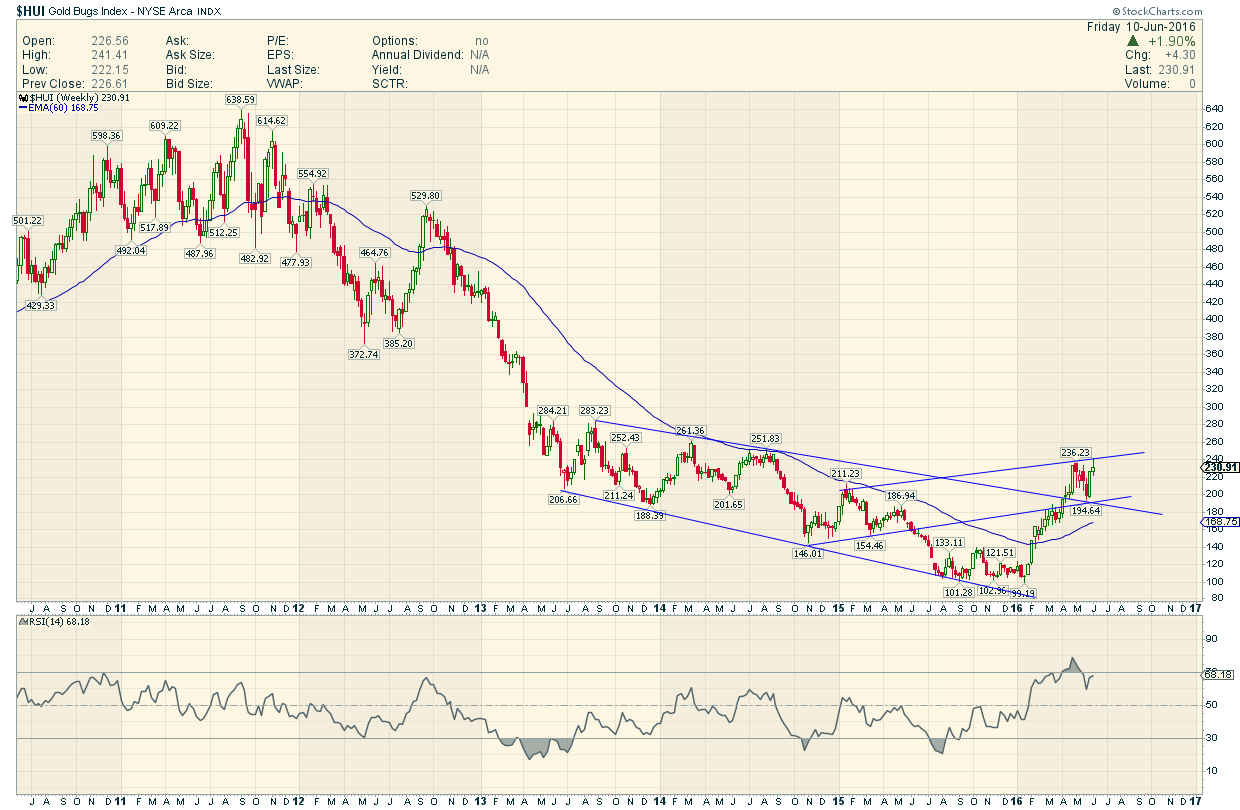
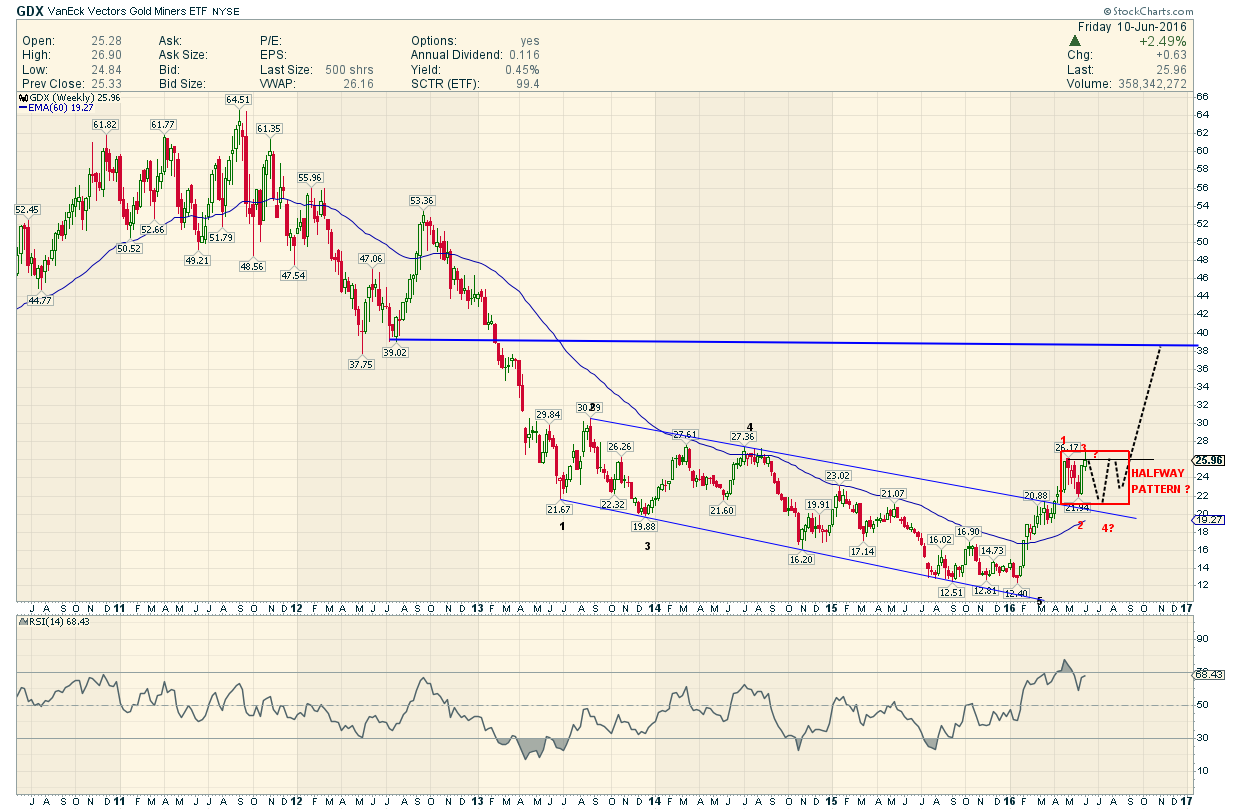
Weekly
….all have broken out of their 3 year down trending patterns with gusto and are consolidating the moves
….There is a good chance we could drop 20 to 25% on all these indices and that we have just put in a point 3
and will hit a point 4 at the end of the summer…from which we could see a launch ( These are possibly panning out to be classic halfway patterns)
…………………………………………………………..
GDX:GLD Ratio Charts
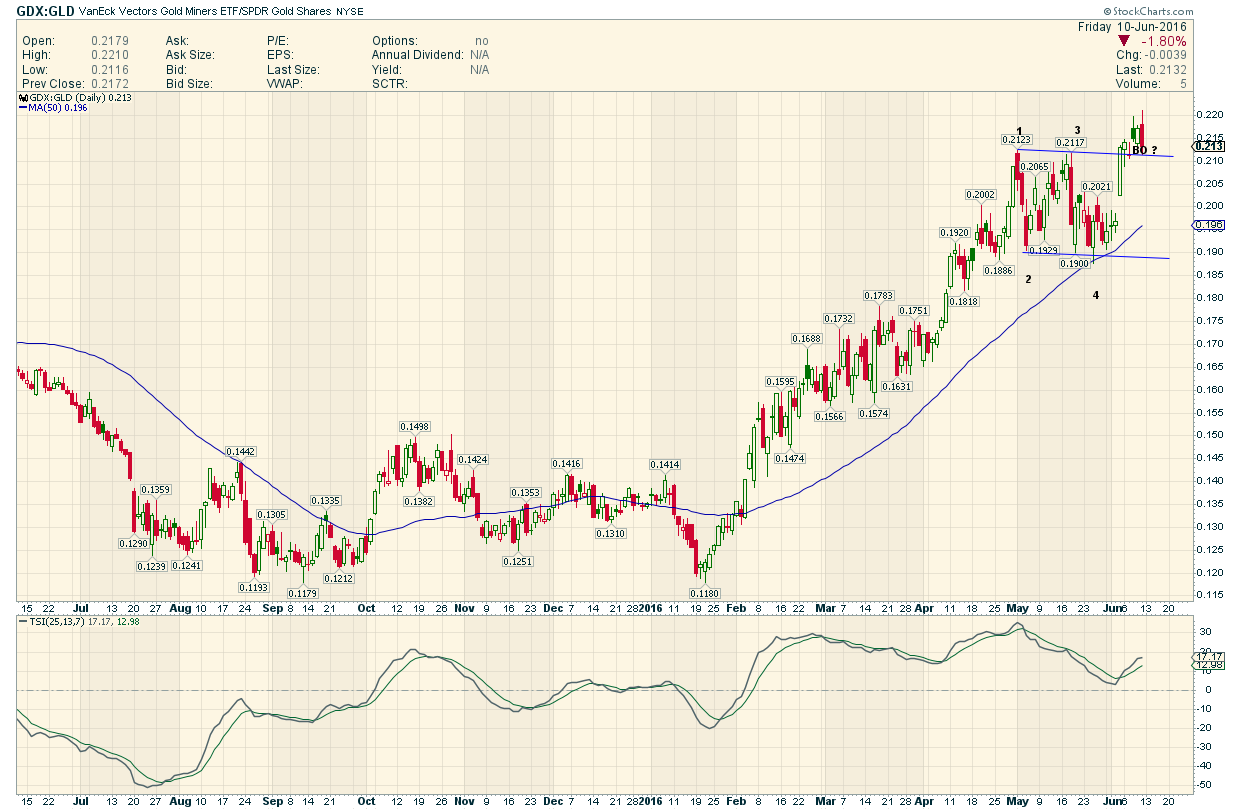
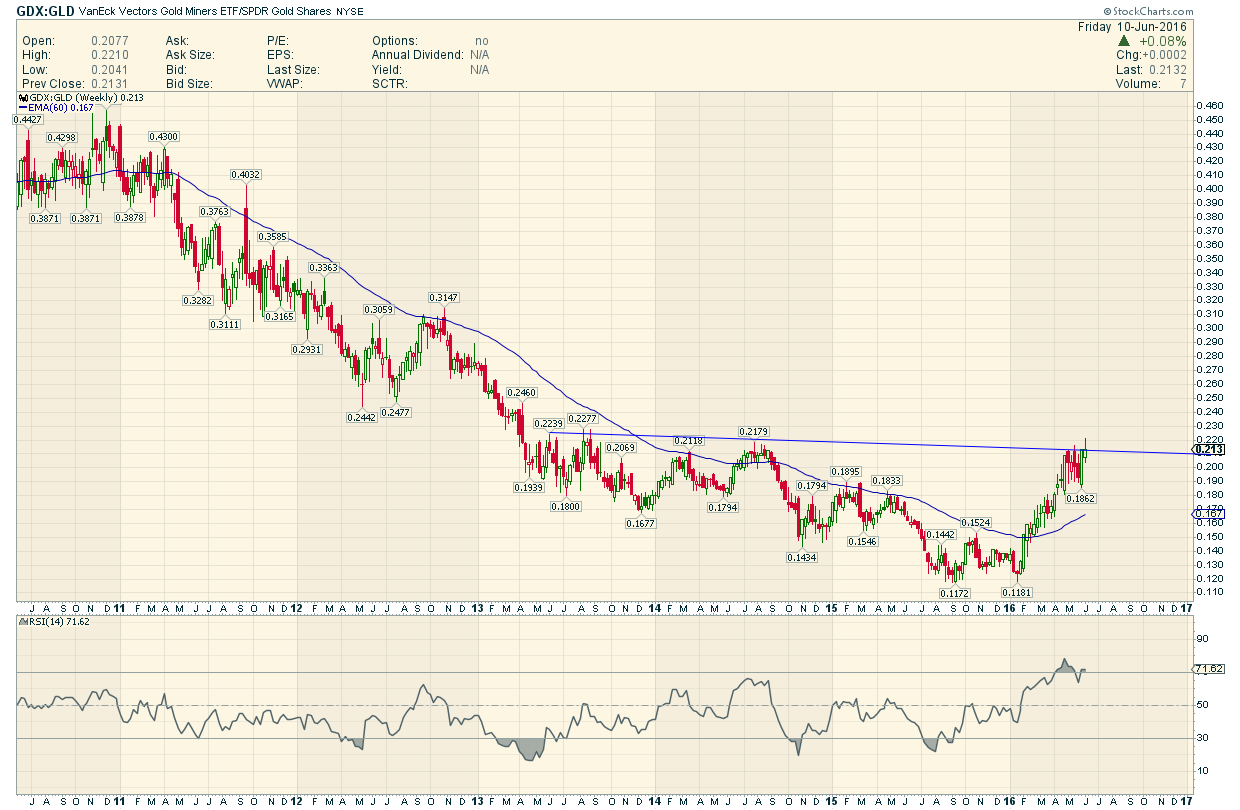
Analysis
Daily…Very Bullish
Weekly…up against very strong resistance
Watch !!!
…………………………..
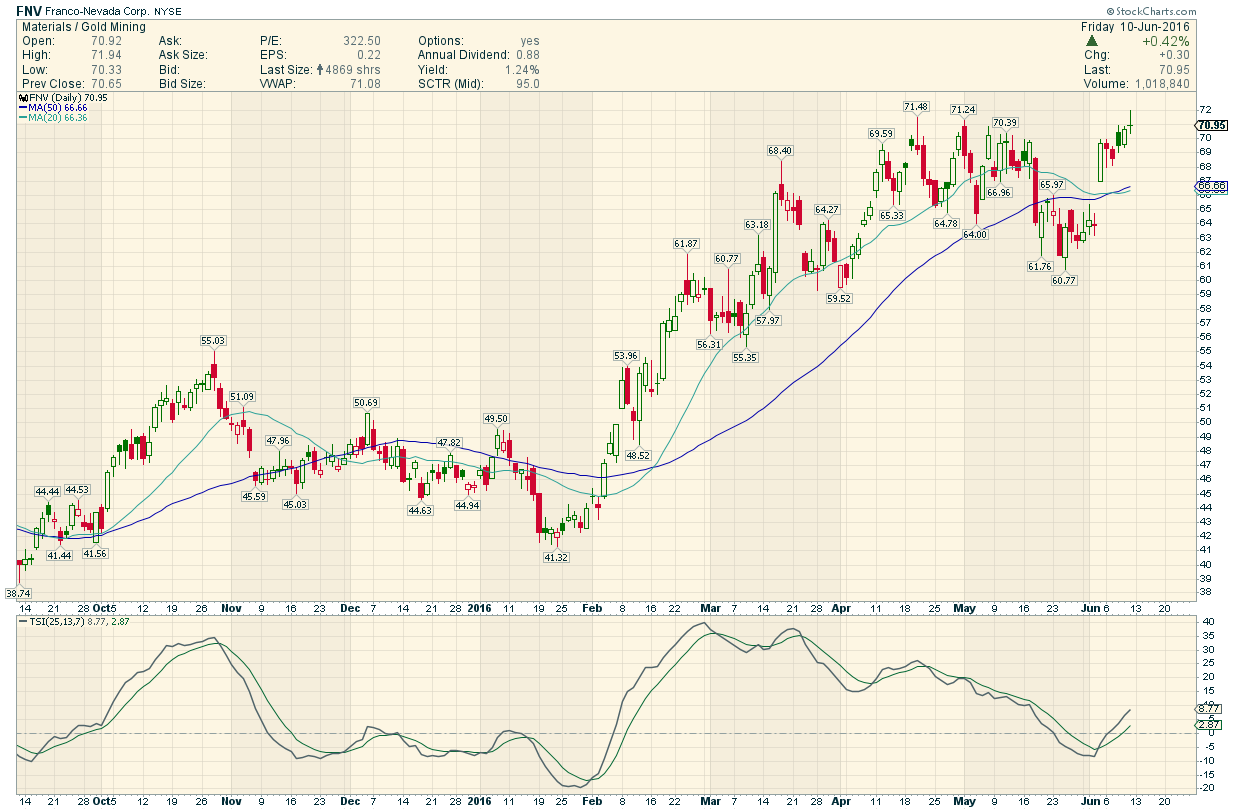
FNV…ALL TIME HIGH
GOLD
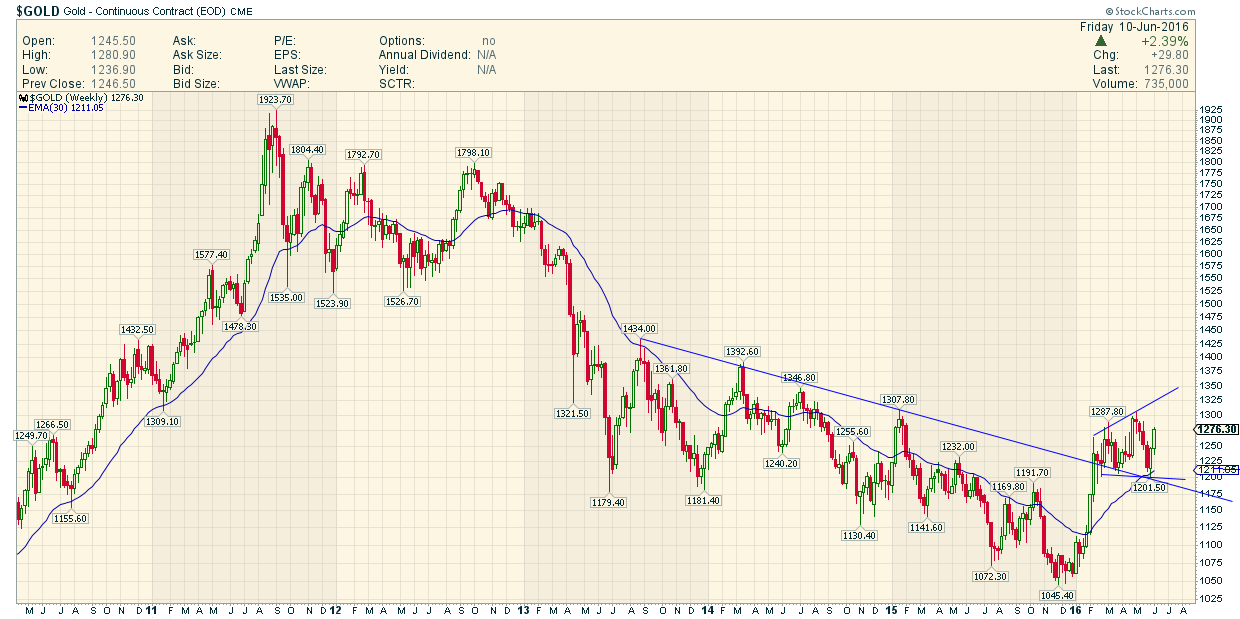
Buillish, now what was that other choice. ???
That HUI level around 350, the area I have made the case to call “Known Values” seems more and more to be coming in focus as an ultimate PO for Phase I. Pretty incredible.
I mention this sector to other work associates and absolutely no one has a clue this is going on. It is still totally below the radar.