Pitchforks on gold: weekly close at the upper line. Where now? Has the bull market been in force all along?
The gold price closed at the top line on my blue Andrews pitchfork after overshooting on Thursday by about $18. I think that is a pretty good match. It is unusual for price to rush to the top of a fork like this and overshoot in this way and interesting that it closed on the line, pretty much. The fork had already been drawn a week ago because it had some support along the median line last year that gave it nice symmetry. Where to now? Well a 5% retracement would take to the median line near $1160 or a full retracement to the lower line would go to $1080. Do you think that, after smashing through resistance at $1180, $1191, $1200 and $1225 in a couple of days, it will reverse and retrace that far?
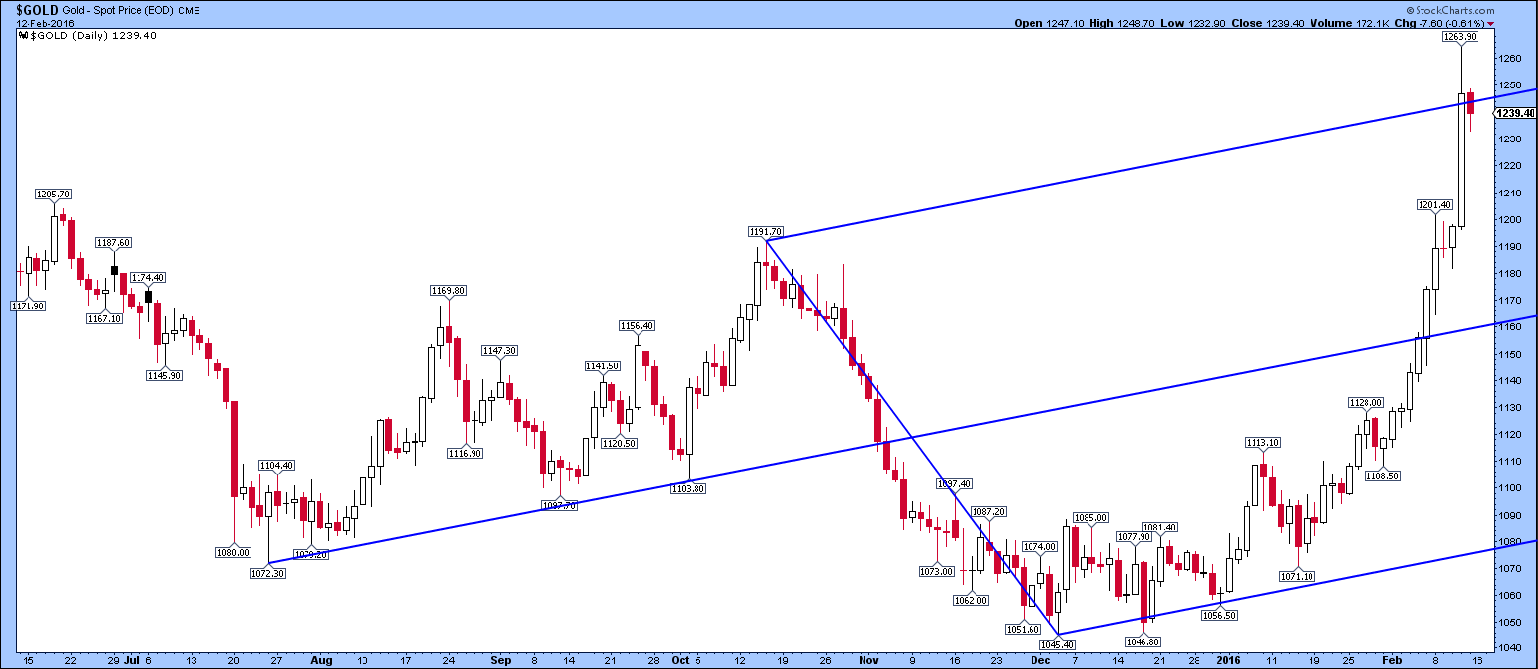
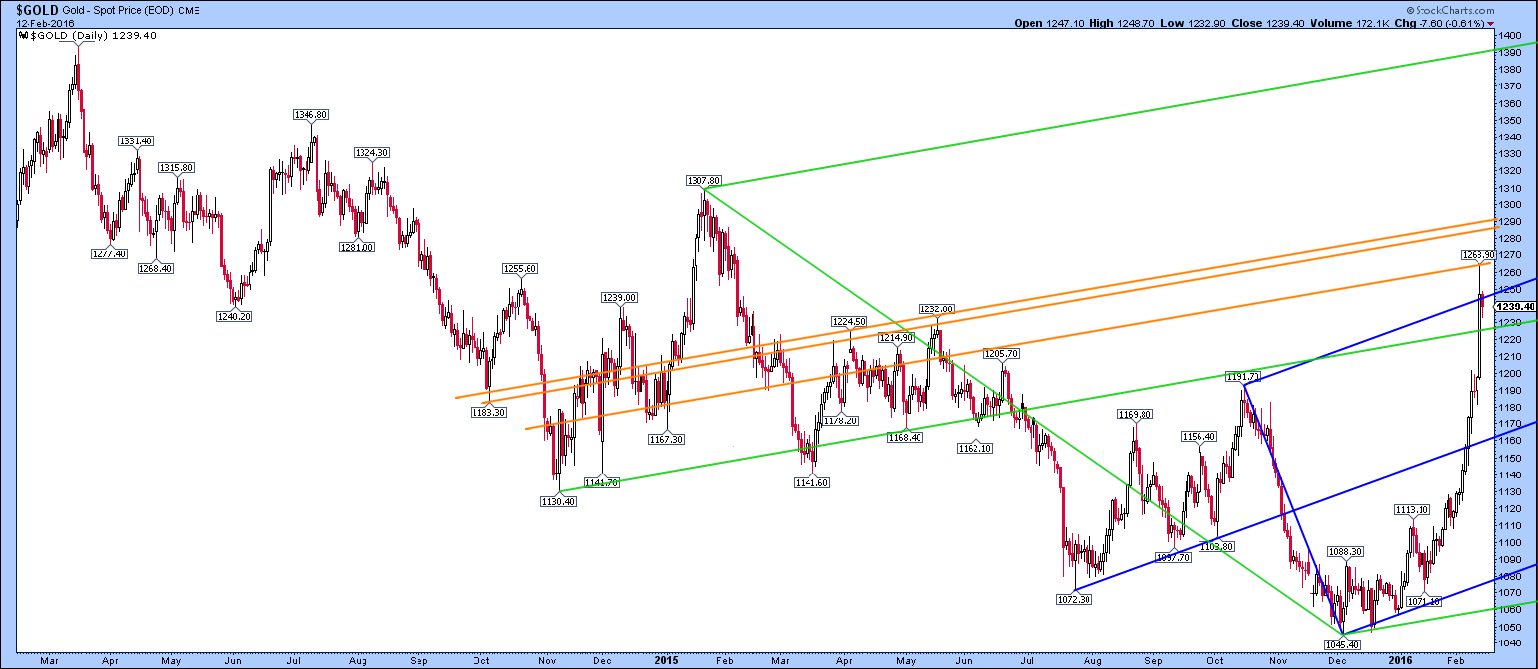
OK, going a little more medium term I had a second (green) fork that had some nice action at the median line in the past. Gold price already overshot the median line at $1220 by over $40, straight into the upper half of the formation. That in itself is unusual for gold over the past 4 years. Usually gold does not even make it to the middle of a fork of any size before rolling over and collapsing out of it. Not so this week. Gold stopped at one of the orange lines roughly parallel the previous congestion zone between $1180 and $1230 from Nov 2014 to Jul 2015. Maybe there will be a little bit of a struggle to get past there to the upside?
Anyway, the top of the green fork is currently $1380, very close to the early 2014 high at $1393. In a little while this line will cross $1393, two resistance lines crossing. For gold to make it to $1393 would be gorgeous symmetry.
In the meantime, where will the pullback go? Friday’s retracement was about $9, very small after a one-day $50+ move, don’t you think? A bit like the Tuesday/Wednesday pullback from $1201 to $1180 before the second leg up to $1260.
Friday evening here in the UK, gold is $1237.90. I would have fancied for gold perhaps to have retraced to the median line of the green fork at $1228 to make things neat (remember folks, $1227.50 was a major high at the end of 2009]. The previous touch on the median line of the green fork was resistance at $1191, more or less in late 2015. A confirmation of support at the green median line would be great for bulls, surely? :
For a historical look, I have these two charts. Here is the marvellous action at the lows near $1050 on the blue fork. Note the origianl 1045 low then the flush, not actually a new nominal low but a breakdown with respect to the fork at $1046 that actually closed on the line for the day. Then the retest of that support at $1056, forming a kind of reverse head and shoulders. Paul Coghlan has noted these kind of patterns before on his webinars and would have called that a ‘flush’ : and bullish. It turned out to be VERY bullish! The next low at $1071 pulled away from the line, then $1108 and up it goes! As far as I am concerned this is magnificent chart action from a visual point of view. No momentum indicators needed, just price action plain and simple. I wouldn’t be surprised if he had gone in at $1056.50 with a tight stop. I don’t know – I do not use his service:

Historically now. I drew some forks on the long term chart (below) and was shocked to find a horizontal fork from the early 2011 low. We recently fell below this fork and have now reclaimed it. Maybe it is not useful now but it has nice symmetry. The main downtrend blue fork was predictive of the $1180 lows in the first place. The current recent forks are also on there in blue and orange. I needed to do this to get perspective and not to get too excited.
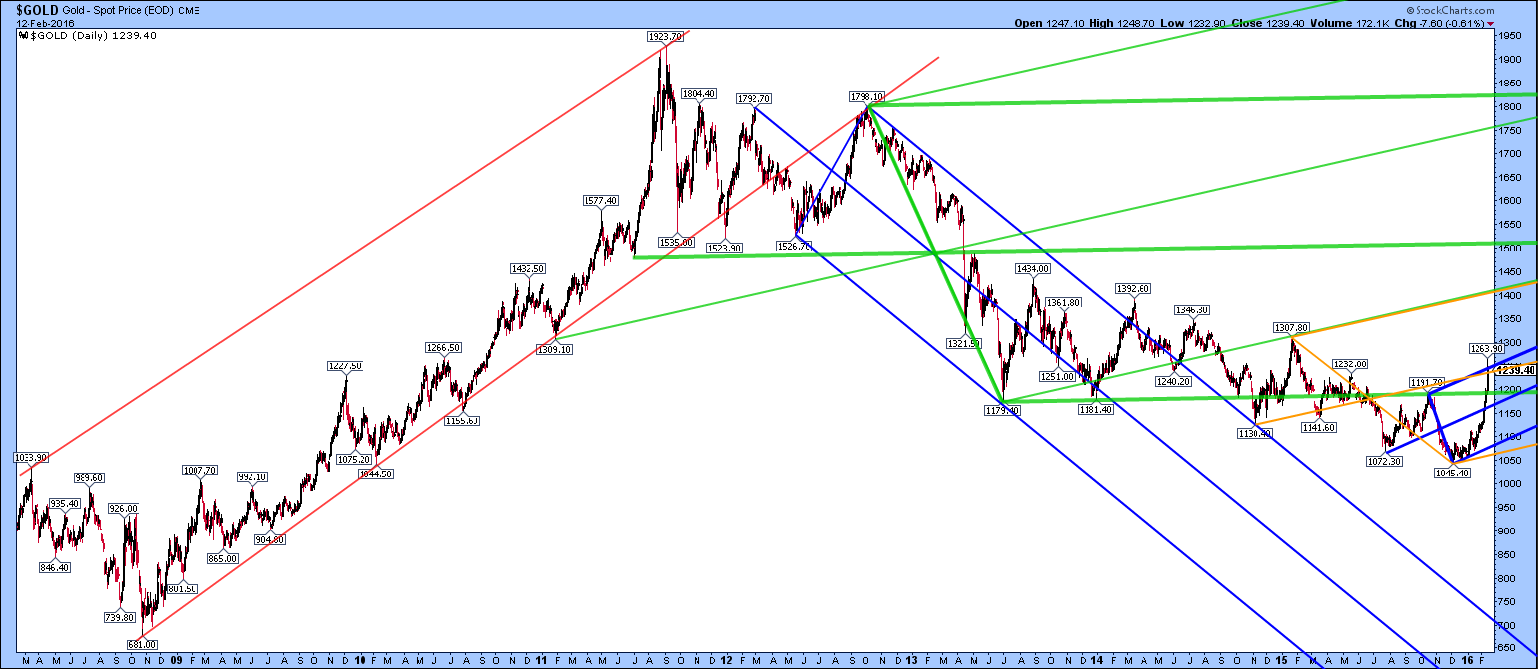
Note finally the sloping green fork from the $1309 low in early 2011 , the $1800 high and the $1180 low. [This $1309 low was after the quadruple top at $1432 that looked to me to be that start of a three peaks and a domed hose pattern. Gold struggled there and looked like it was rolling over – then it went ballistic. Note how these figures were matched almost exactly in the ensuing bear market by highs at $1434 and $1308 in 2013 and 2015.]
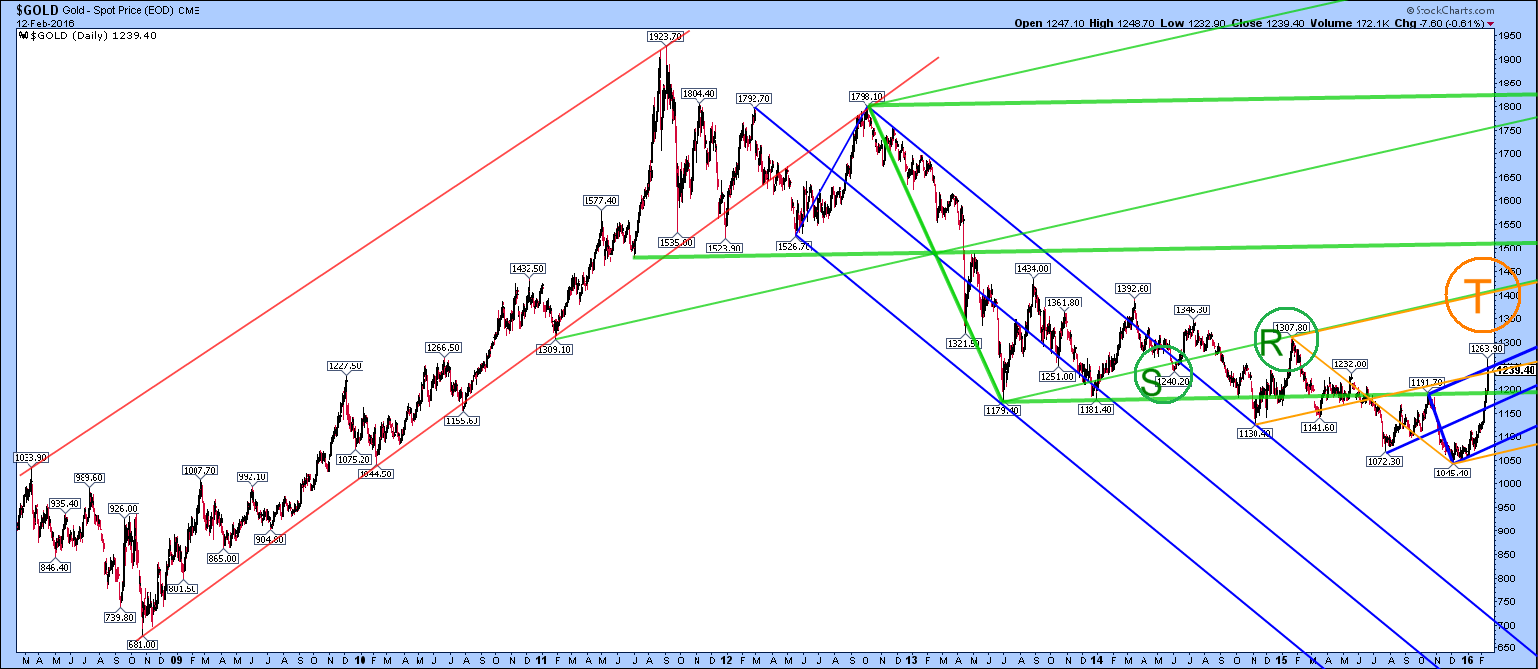
I have marked where support at the lower line turned into resistance (S into R in green, below). Gold is still below that fork BUT the ORANGE fork is PARALLEL to the sloping green fork and is half as wide. What do you know? It’s just an extension! To get back into the upsloping green fork needs $1390, point T (orange). Also, this is through the top of the orange fork and the 2014 high and then the bear market would be over, over, over, surely? :
The slope of the current trading was dictated way back in January 2011 by the start of the sloping green fork. “Fascinating!”as Spock would say.
Nice charts, Dave. Hard to imagine it coming all the way down to the bottom of the forks.
I LOVED looking at those charts! Thanks for putting them all together
The one thing I like about my upsloping green pitchfork is that the origin is on a bullish change of behaviour at $1309 early 2011 (the start of the bubble phase) and the median line goes right through the second change of behaviour, the POR or crash through $1500 on 12-15th of April 2013 (the end of the bubble phase). The present orange uptrend is parallel, almost exactly.
Thanks for the compliments by the way!
If anyone knows of a TA job I am all ears!