Just For Fun
A quick guide as to where I think we will end up. I’ll be much happier and more confident once we get past this patch of turbulence.
A quick guide as to where I think we will end up. I’ll be much happier and more confident once we get past this patch of turbulence.
The AUD chart is troubling. You might remember my chart from a few days ago – the dollar rising to back-test from below…

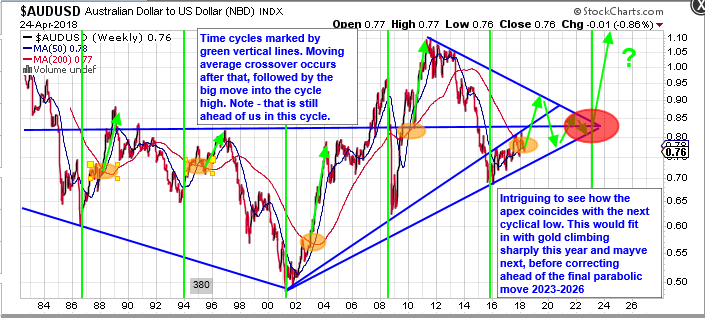
If the dollar resumes its downtrend after this test (which it will need to do soon), it means the AUD and AUD/USD pair will resolve to the upside. Here’s another chart of AUD/USD. It’s the daily, linear chart, which puts a slightly different slant on things.
The downside space on this chart, just about matches the upside limitations we have on the dollar. If they breach, we’re screwed.
What do you think ? Inverse head and shoulders or bear flag ?
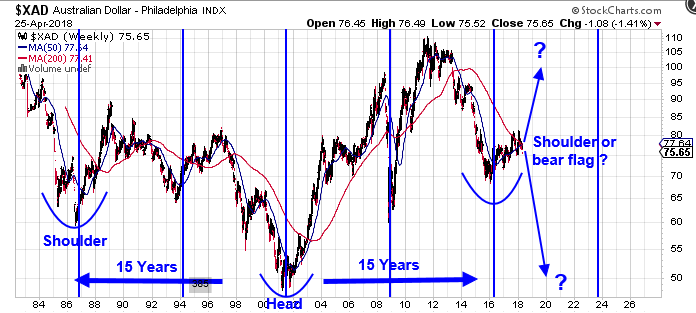
If it’s a bear flag, the PM’s are screwed and we’d be looking at sub $1000 gold and $10 silver. HUI would probably fall well below 100.
Edit – If this is an inverse head and shoulders pattern, the neckline is sloping from lower left to upper right.
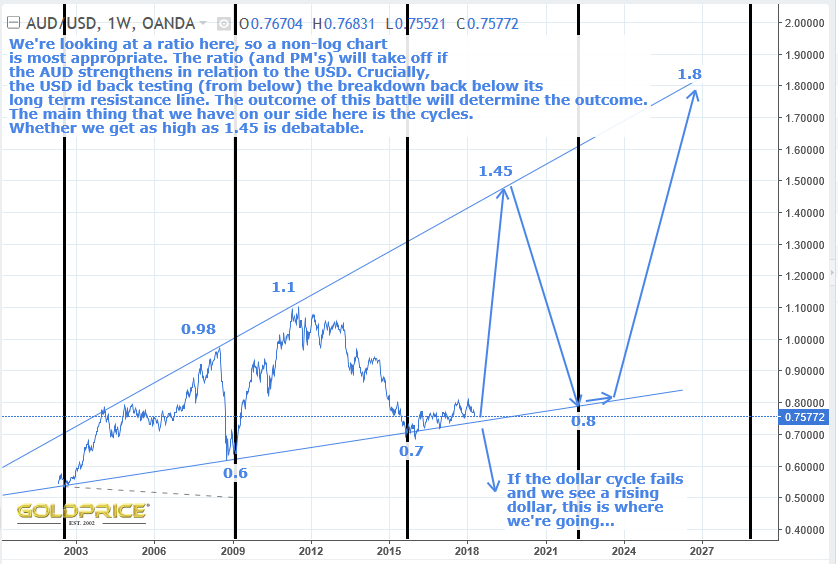
…what you find when you start looking. Talk about jigsaw puzzle – the AUD/USD pair seems to fit perfectly. I hope I’m not being biased here, but this is what the chart is saying to me, and it matches perfectly with my current expectations. Thank you Fully for your earlier post, it prompted me to dig into this a bit. Whether the AUD/USD rises for a couple of months or possibly up to 18 months or so, we’ll have to wait and see. The possibility of a drop to the bottom support rail right now is (in my view), very low. That’s based on the time element (see my earlier post), and the fact that we are only just getting to the moving average crossover after the cycle low. Look what happened during every other cycle.
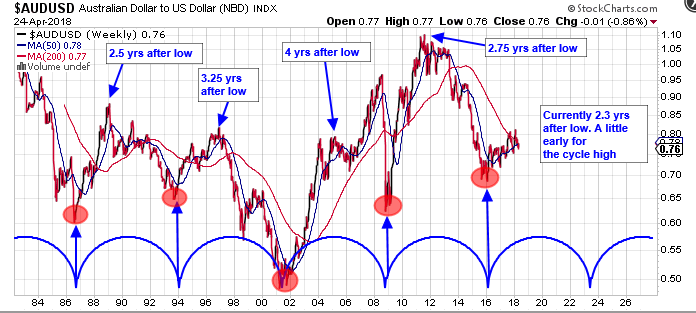
Following Fullys excellent chart earlier, I thought I’d see how we’re doing from a time point of view. This currency pair has a very reliable cycle (trough to trough). Each cycle low has coincided perfectly with the ratio making it’s low. The time taken from that point to the cycle high has been varying from 2.5 to 4 years. At the moment, we’re 2.3 years from the last cycle low. That gives us at least another couple of months, unless we’re getting an even shorter time span from low to high. Based on the average though, this should resolve upwards at this point in time.
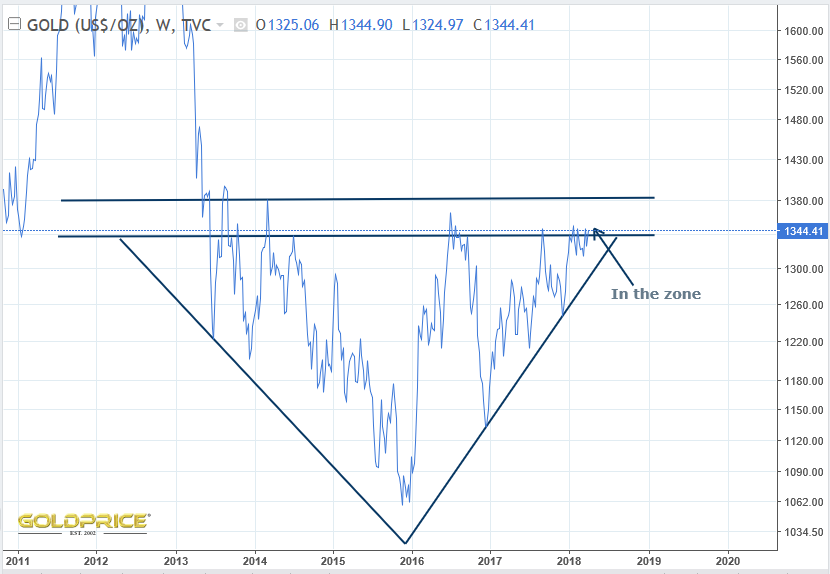
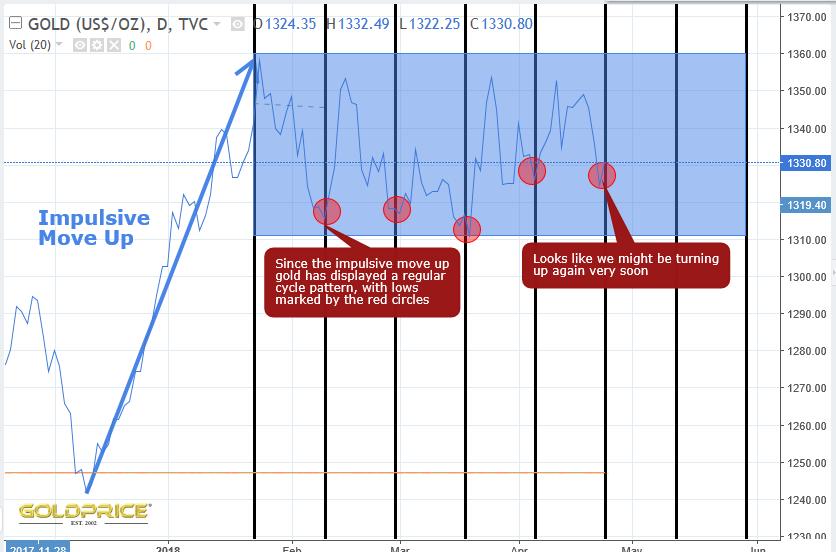
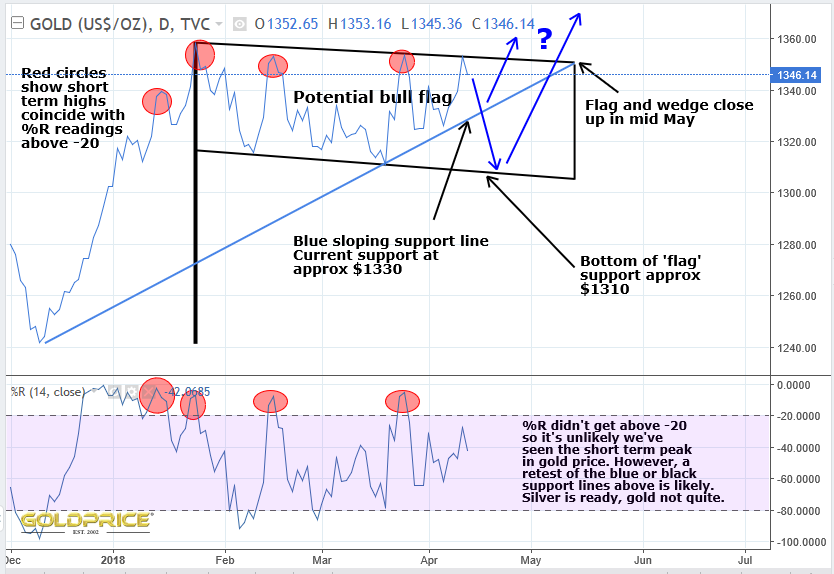
Sideways consolidation continues to build the golden flag. Looking at the cyclical pattern of lows, it looks to me as if we could be about to turn up and have another go at breaking out. If not, you can see from the chart below where the support is and when we’ll get another chance.
Here’s yet another way of visualising where we’ve been and (if the cycle repeats), where we’re going. If the dollar cycle gets broken, all bets are off, but I don’t think it will.
Coincidence ? I don’t think so…

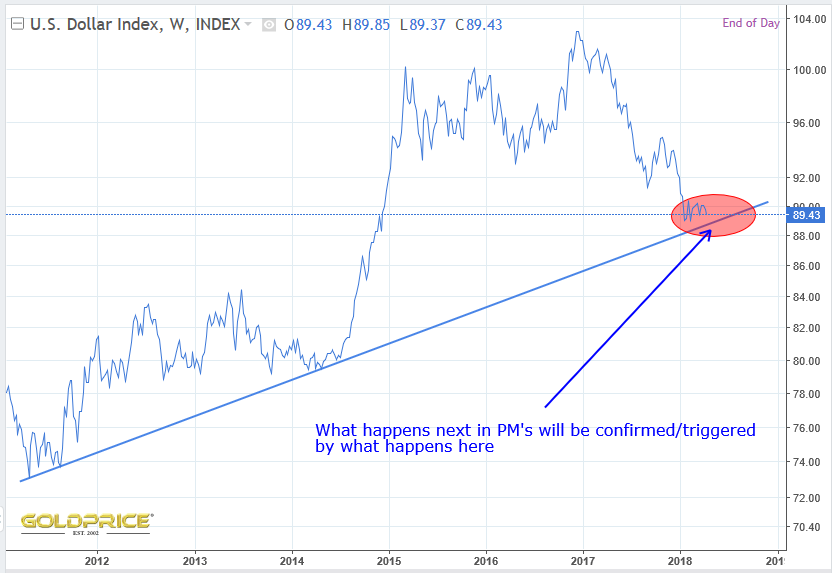
Until this is done, and the dollar bulls roll over, gold and silver will be held in check. I think this is the final (doomed to failure) move for the greenback. All we can do is sit back and wait for it to play out. Here’s how I’m seeing the next 16 months…
First off, two simple charts. Gold and the Dollar…
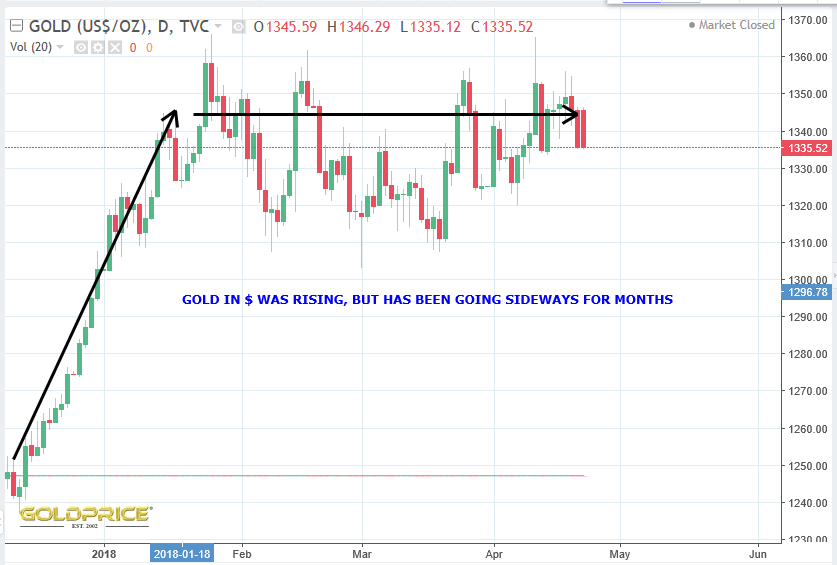
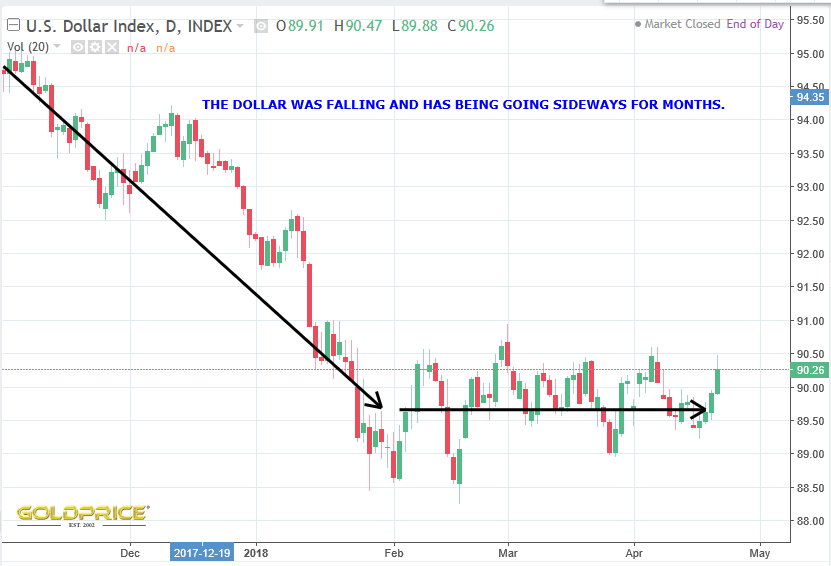
Both are still on pause, staring at each other, waiting to see who blinks first…

It’s my view that the dollar will prove the weaker of the two at this point in time, and gold will benefit. Here’s why…
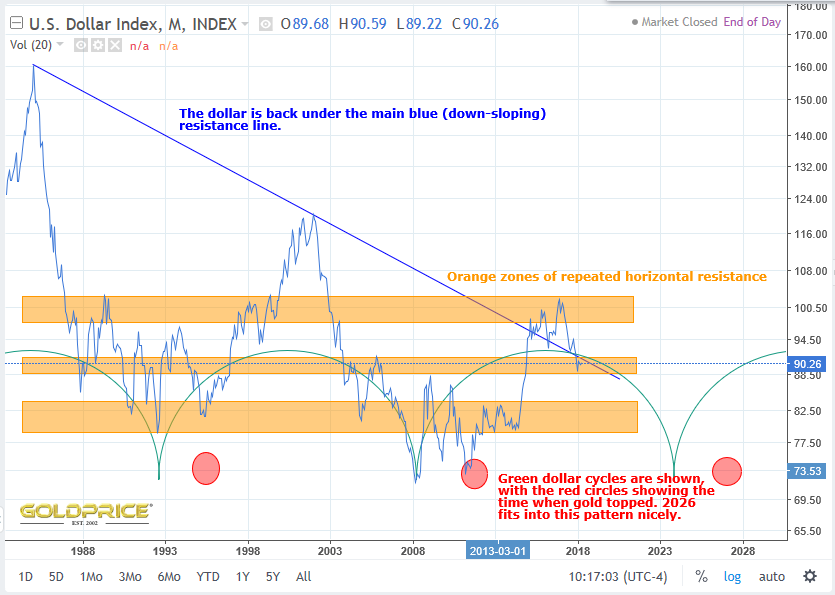
And a final bonus chart which includes the all important cycle which drives the pattern above, along with red zones to show the times in the past when gold peaked and where the next gold high fits in…
A couple of interesting charts in this short article http://www.marketoracle.co.uk/Article62083.html
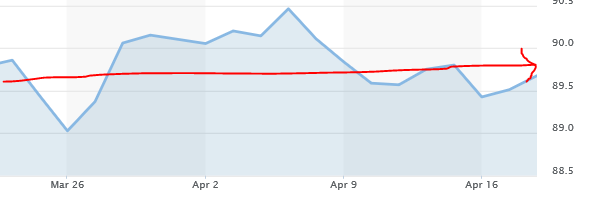
This is really important. It’s probably not a real bull market if you don’t have relative strength. Without it, gold is just reacting to the changing Dollar (or whatever currency you want to ‘value’ it in). The metals need to gain over and above the percentage falls in the dollar. If the dollar drops 10% in the next 6 weeks (which I think it might), then I’d like to see gold go up by 15% and the miners at least double that. Hopefully you’ve noticed the metals holding up and in fact rising lately, with a background of a steady Dollar. My view is that the metals are aware of what is coming next (or at least the big players in the metals are). This is giving us a hint that the dollar is destined to fail at that critical support level (where Surfs ‘dualling forks’ intersect). That is when this thing really hots up. Three charts going back a month or so – first, the Dollar…
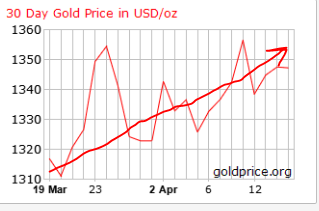
Now Gold…
And finally, silver…
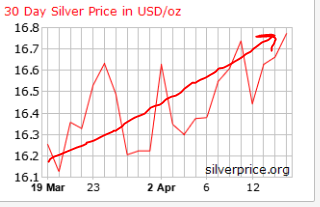
Are you seeing what I’m seeing ?
We all know there is a pretty rare position in silver COTs at the moment, but I thought I’d take a look at gold. I’ve read reports that it isn’t as favourable. Looking back, I don’t think I agree. Without going into what each of the lines means in terms of the commercials/speculators etc, you can see that they’re at levels which (historically) are very supportive of a long, sustained bull market. That’s pretty much all you need to know.
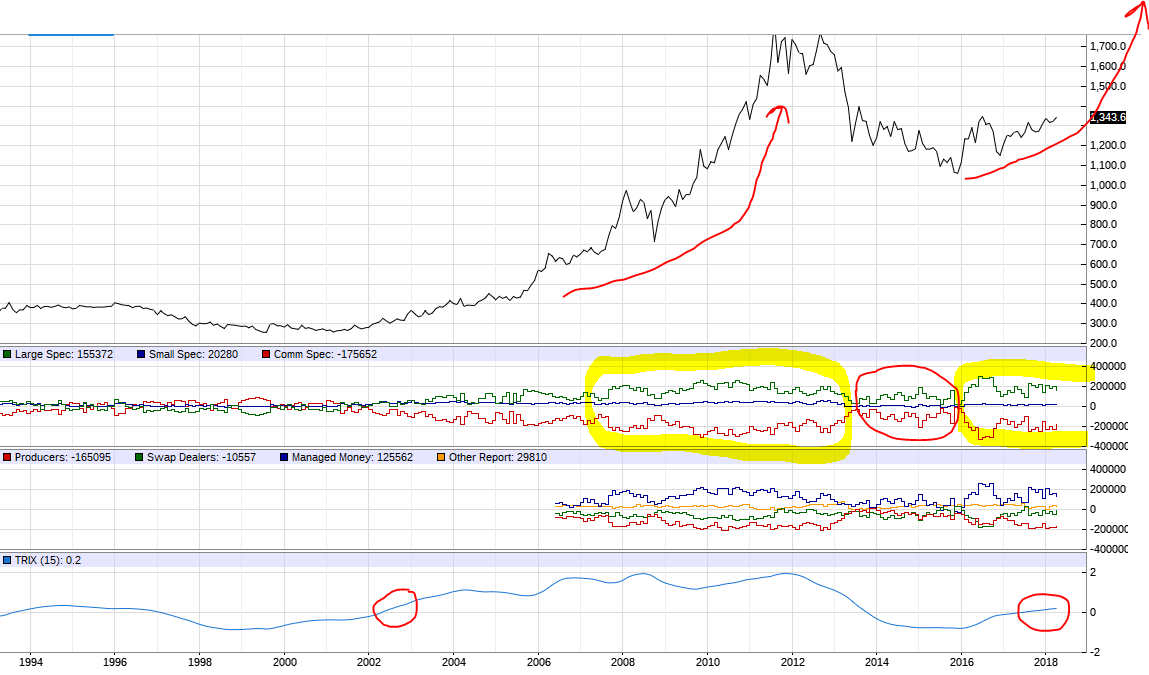
Also, take note of what the TRIX indicator is telling us.
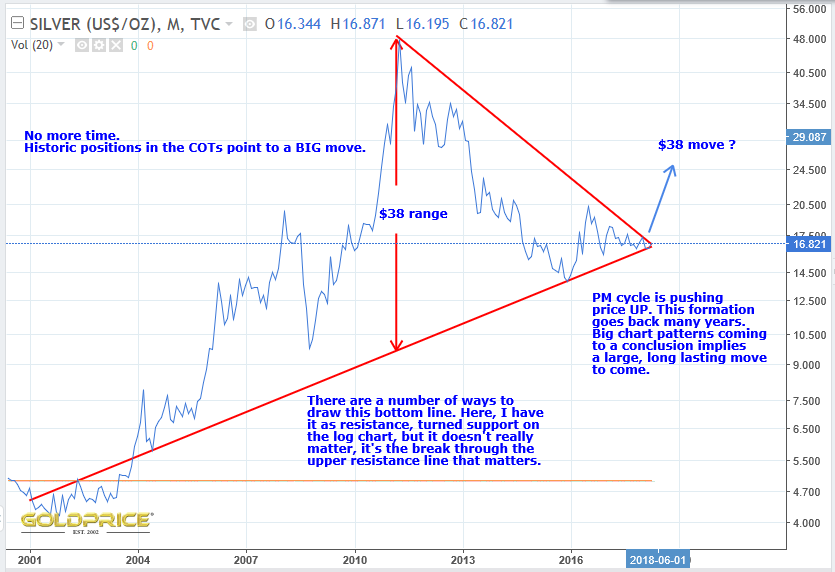
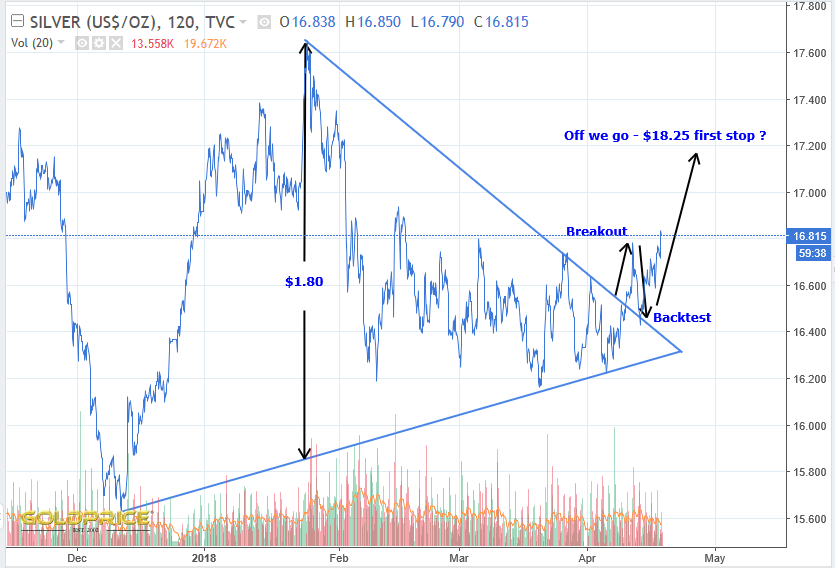
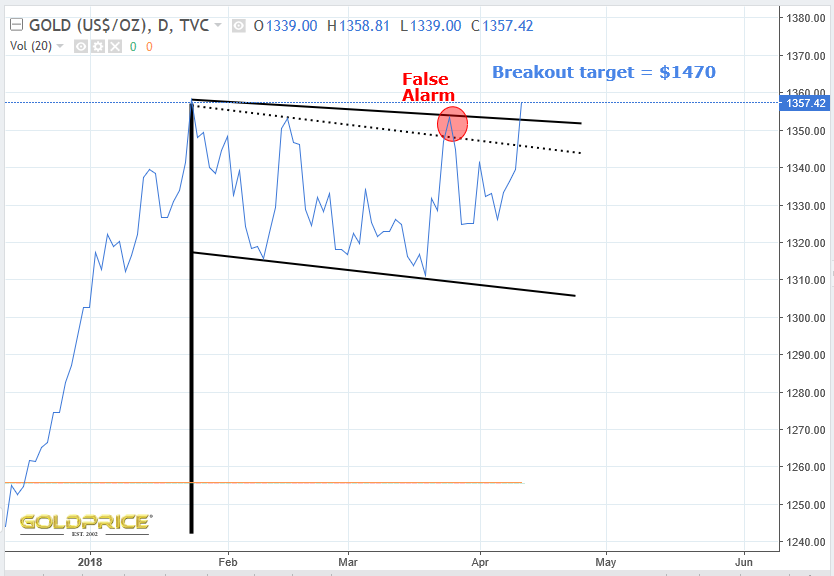
Just a little further and I think we can be much more certain, but we’re getting very close to the most significant breakout in silver for decades. The breakout from the shorter timescale chart patterns are already occurring. The wedge breakout was near textbook. Breakout, backtest and now we’re off.
Well, it’s been a long time coming, but we’re finally getting there. There just isn’t really anywhere to hide for these 3 amigos. We’re approaching a final fork (pun intended) in the road. As Surfs excellent post demonstrated. You’ve also seen Spocks analysis. Gold and silver will be heading one way, and the dollar will be heading in the opposite direction. Which is destined for the basement, and which is on it’s way to the penthouse suite ? You decide.


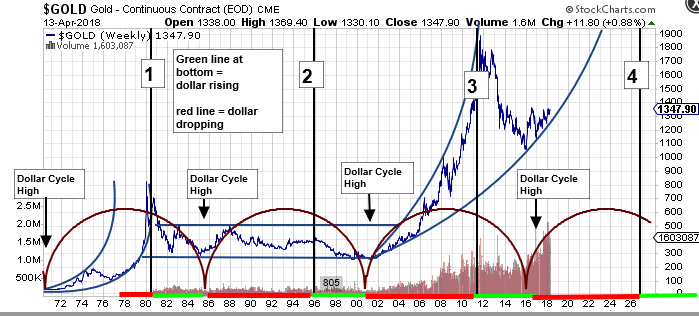
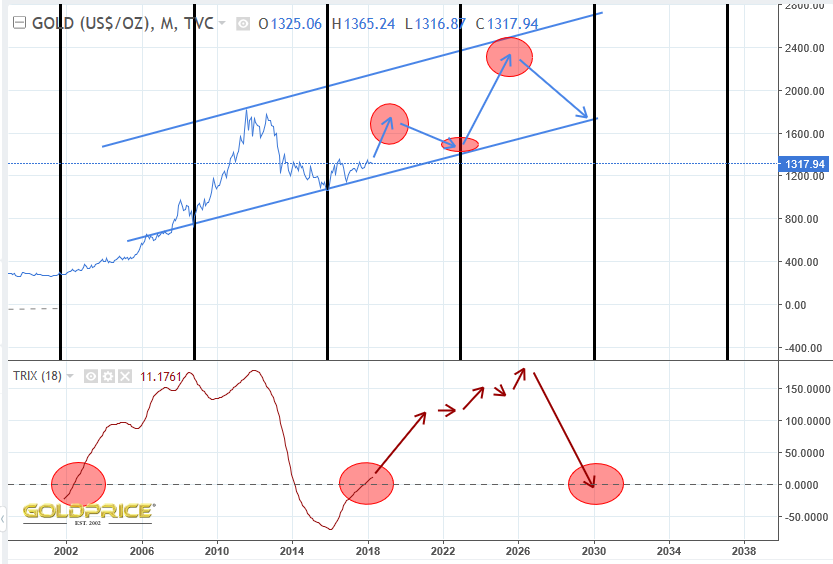
Gold low, dollar cycle high behind us. Any moves/patterns going forward to 2026 should resolve to the upside.
Only 20% off the all time highs. Also a long consolidation (even looks like a large cup and handle, which is usually resolved to the upside).
The point is that this doesn’t make any difference to my view for PM’s going forwards
The day to day price movements can be frustrating or exciting, but the larger picture is more important (to me at least). I want to be on the right side of the trade. This is where cycle analysis come in. On the following chart I’ve marked golds 4, 8, and 16 year cycles. The time zones marked in red show when all 3 cycles are heading down – gold price will fall. The green zones show when all 3 cycles are heading up – gold price will rise. The blue vertical lines show the 16 year, so called K-Wave peaks, with gold price highs occurring at those points, about two-thirds of the way through golds 8 year cycles. The next peak appears to be due in late 2026. Pullbacks expected into 2020 and 2024. On that basis, I’d expected a sharp move up in 2018 and 2019, and again 2021 to 2023, with a final , possible parabolic move to the final peak taking place after the 2024 low into 2026. Here’s my chart, and I hope it helps a bit in terms of a roadmap…
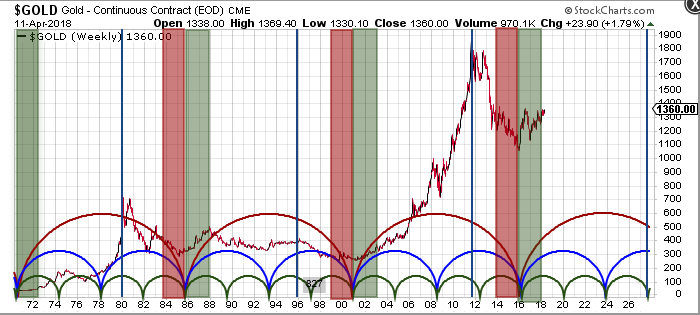
The 16 year cycle from 1985 to 2001 was interesting. Price action was incredibly muted. My explanation for this is an expanding economy coinciding with a cyclical uptrend in equities, and, crucially, the dollar index. The stock marked soared during this period, and sucked investment away from PM’s. The dollar index cycle was up from 1995 to 2002. This prevented gold (priced in dollars), from realising its potential. The index rose from 80 to 120, effectively cutting golds potential dollar value in half. So, what’s the situation today ? If the stock market is at a low point, having just suffered a proper bear market, and if the dollar is at a cycle low, with years of rising ahead, gold will struggle badly. If the stock market is nearing the end of a historic bull run, and the dollar is coming off it’s cycle high and heading for its next cyclical low, gold’s full potential will be unleashed. Where do you believe we are ? Invest accordingly.
Keeps you guessing doesn’t it ? The wait continues…
This is really worth reading, and a great Donald Trump reference as well (written in 2006)…
https://www.gold-eagle.com/article/golden-opportunity-three-phases-bull-market
Potential simultaneous failure of the dollar at key support as gold breaks above key resistance. This is textbook stuff…if it happens 
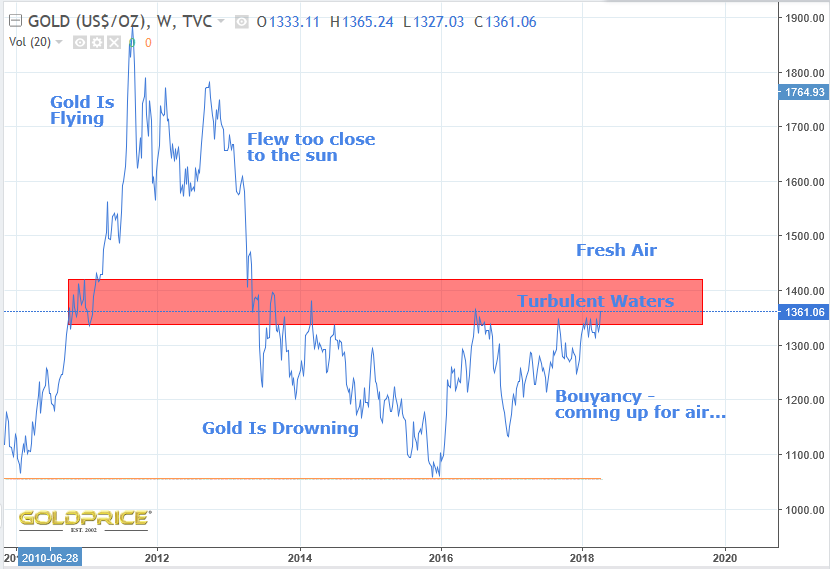
Will It be a simple, clean burst out into the fresh air, or will gold struggle to reach terminal velocity ?
Why ? Because the gold cycle is in its UP phase until 2026, and the dollar is in the DOWNWARD part of its cycle until roughly the same time.
For those that didn’t read the link in my last post, this is the whole point at this stage in a gold bull. Initial surge, then sideways grind (the wall of worry’). A healthy bull cannot proceed without it. Selling pressure needs to be all but exhausted, for the next phase.
This may, or may not, be the real deal breakout I’ve been expecting, but either way, we are in a gold bull and dollar bear for several years now (in my opinion).
It was writren in 2006, half way through the last gold bull. History is the best teacher of all
http://www.zealllc.com/2004/au3stage.htm
Edit: written in 2004
As the dollar breaks support, I’m expecting the PM rally to resume in ernest. Not long to wait now. This month or next.
Bikoo dropped this link in an earlier post, but I think it deserves a post of its own. Well worth the read https://www.goldmoney.com/research/goldmoney-insights/why-a-dollar-collapse-is-inevitable
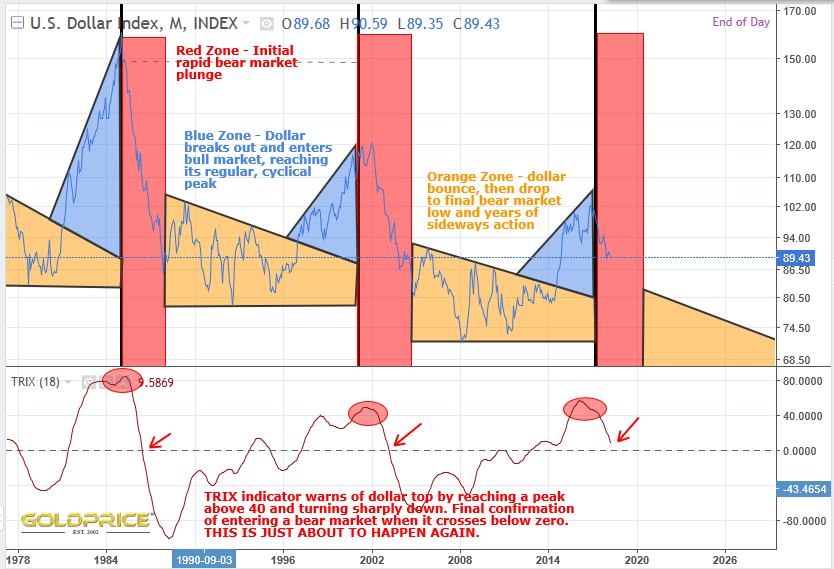
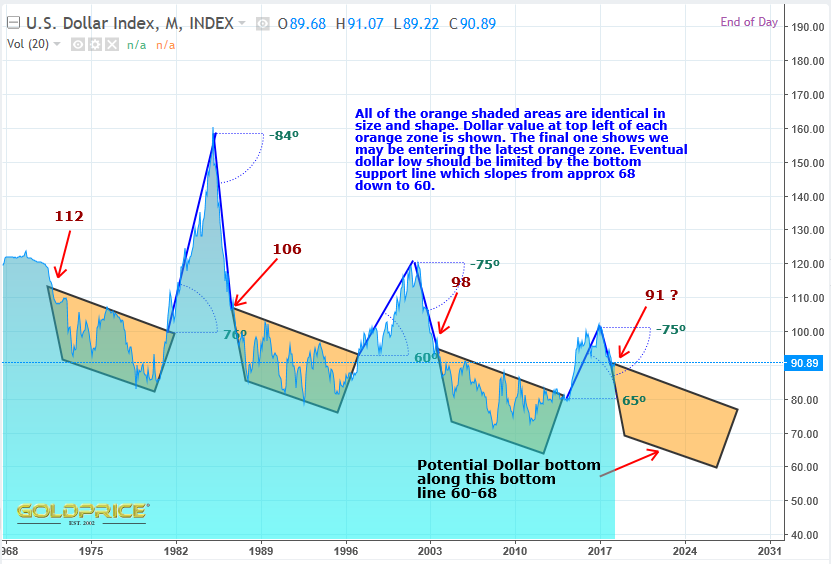
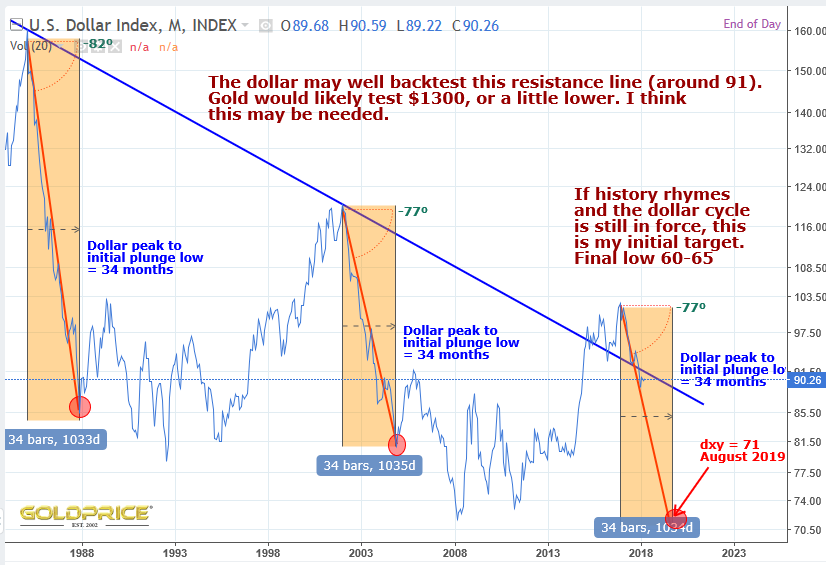
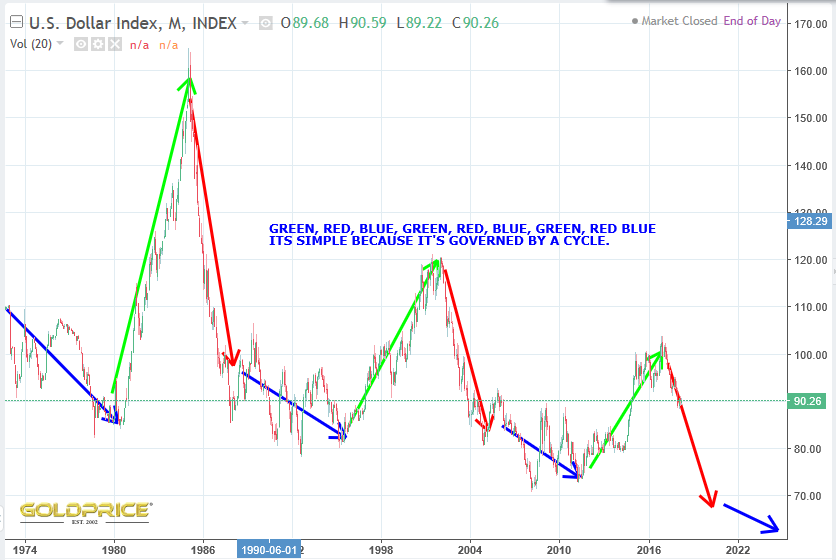
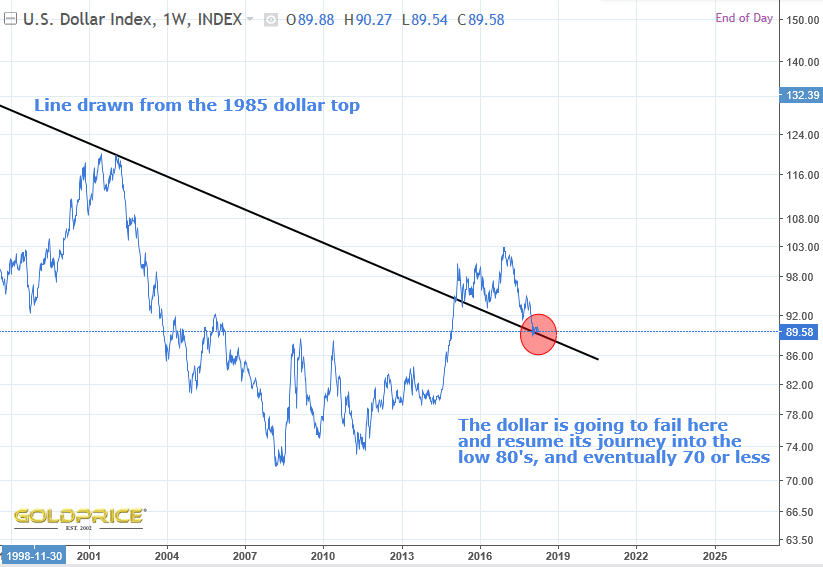
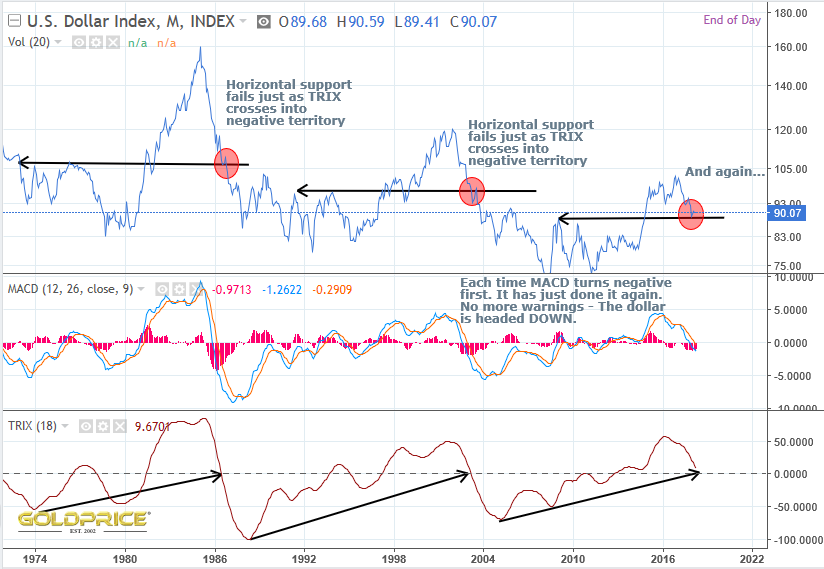
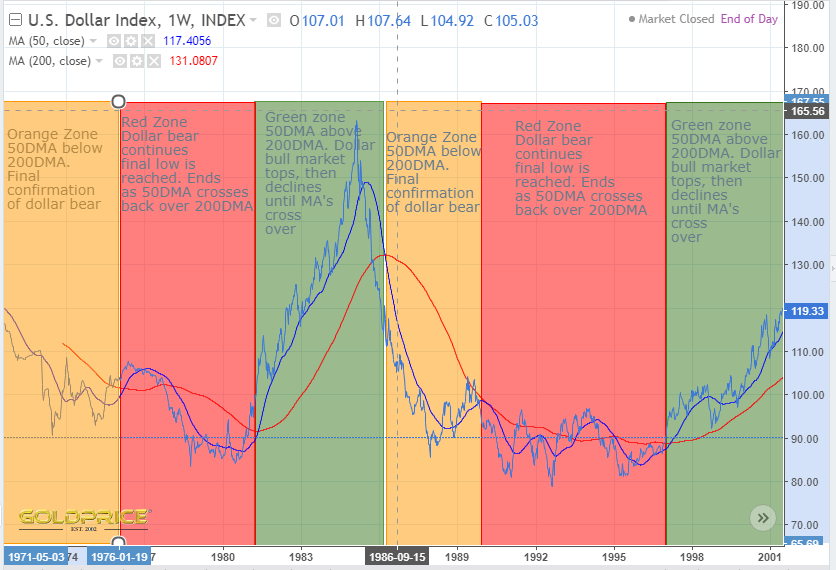
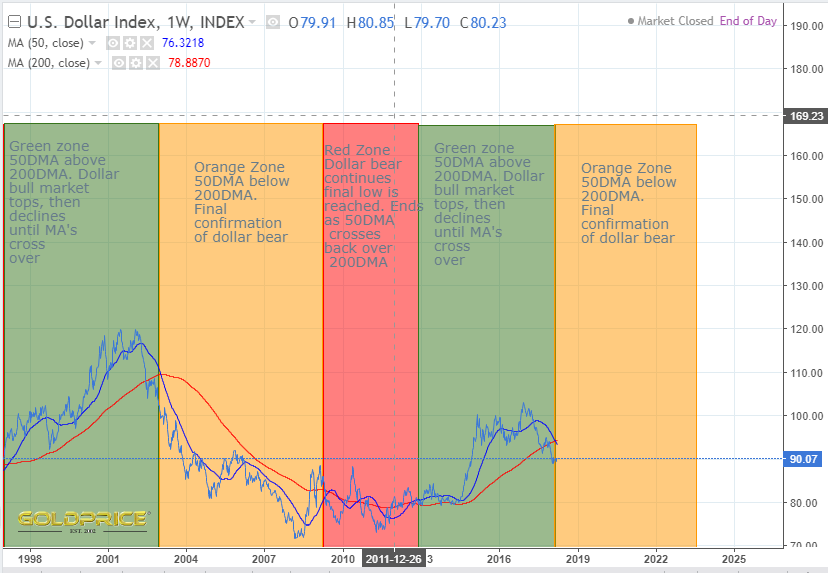
History teaches us many things. It seldom repeats exactly, but patterns and rhythms exist. Ignore them at your peril. Unless a very well established pattern is about to fail, the dollar has just signalled it’s in bear mode. the 50dma has crossed back below the 200dma. Going back through this, and the last 2 dollar cycles you can split each cycle into 3. Each is clearly labeled on the following 2 charts going back the 1960’s. It’s as simple as green-orange-red, green-orange-red, green-orange-red. You get the idea…
This chart pattern is literally shouting dollar bear at you. If you can’t hear it, you need to get the wax out of your ears. Can the dollar reverse and go up ? Yes, but only if this sequence is blown out of the water. Looking at the US fiscal position and its currency I just don’t see that happening. My opinion ? This pattern is happening for a reason. It’s not random, but symptomatic of global currency trends. Do your own research. Don’t accept anything without questioning and checking it first. I still haven’t seen or heard a single argument that accepts this historic pattern and explains why it wont follow the same descending path as the previous cycles.
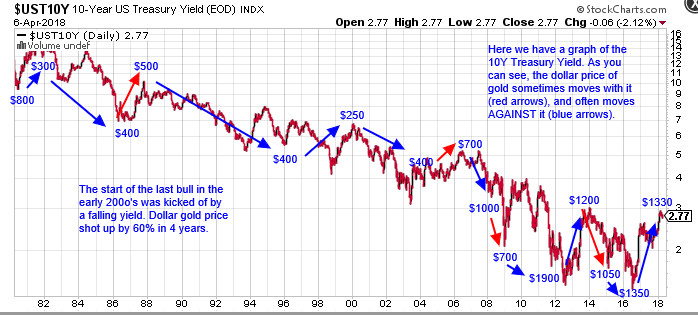
In response to EagleSeagles interesting post and link, I thought I’d take a closer look. Here’s how gold and the 10 yield have been getting along…
Now the US 10 year yield minus the German 10 year yield, versus gold price…
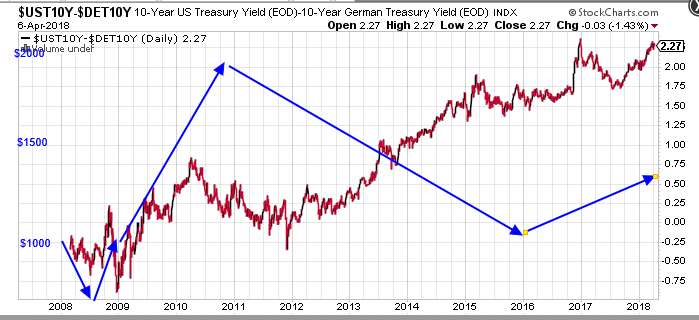
The trouble is that I can’t find this comparison of these yields pre 2008. Even so, you can see the relationship is sometimes positive and sometimes negative with gold price. The same goes for the CRB index…
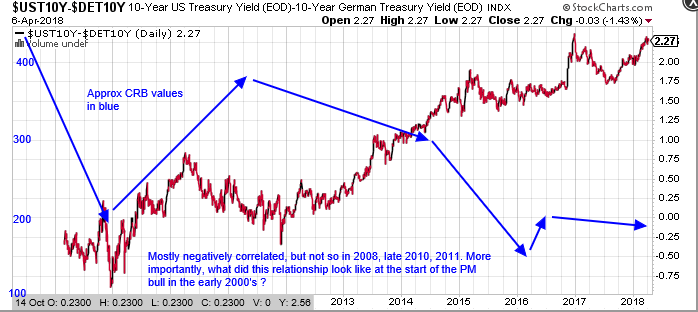
In my view, the Tom Bowley article, whilst interesting, is fatally flawed. It doesn’t prove a causal link. Even over this ridiculously short timescale (since 2008), the CRB and gold price movements are not always in sync with the US/Germany 10 year yield difference. In order to even begin to draw a conclusion, you would need to find data going back through a minimum of 3 economic cycles. I’d be particularly keen to know how it looked from approx. 1995 to 2008. So far there is nothing in this data to show that commodities or PM’s are heading for a drop or that the dollar is heading back up in any meaningful way. I’m not saying that can’t happen, just that this information isn’t robust enough to support any conclusions at all.
It looks to me as if Libor-OIS rising is just what we need. It did the trick last time…
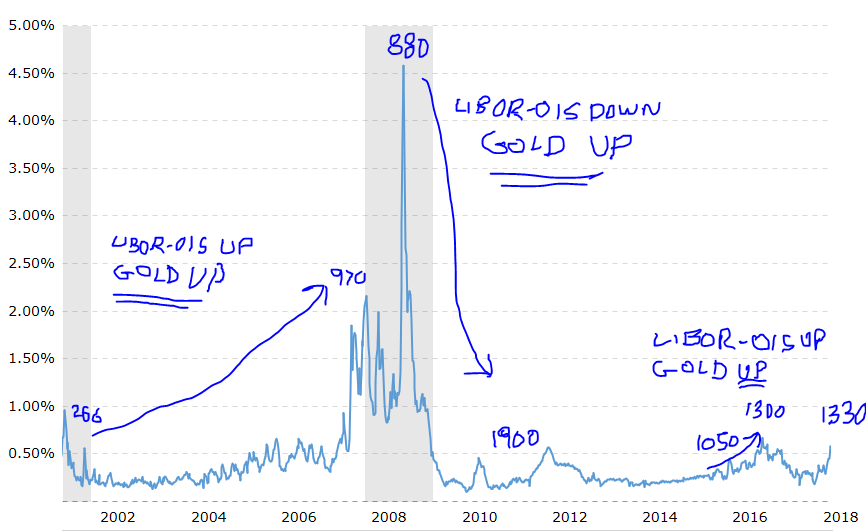
The numbers are the dollar price of gold. Sorry for the terrible scribbles.
EDIT – Chart corrected
All this debate about whether the PM’s are really in a bull market or not is going to be settled when this chart resolves itself. Up or down ? Place your bets now please…
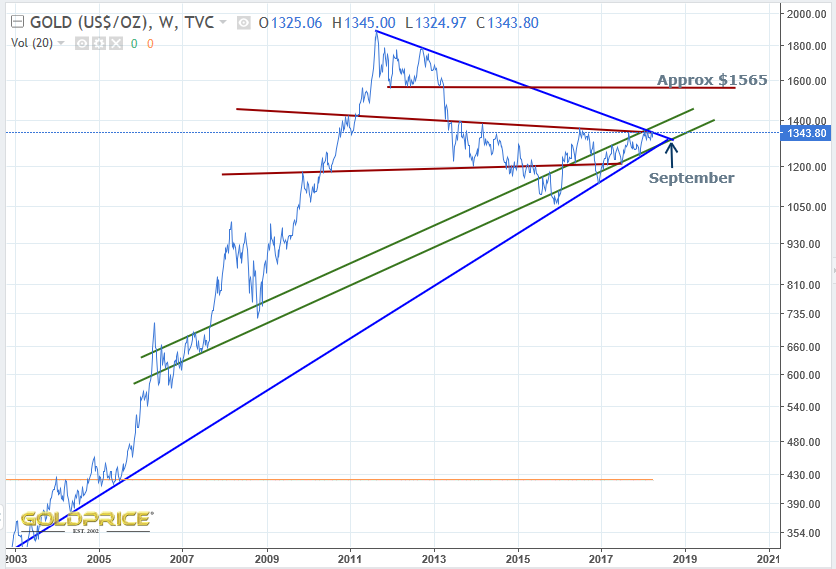
Will it, or won’t it ?