Confirmation – The Dollar Is About To Fall Much Further
History teaches us many things. It seldom repeats exactly, but patterns and rhythms exist. Ignore them at your peril. Unless a very well established pattern is about to fail, the dollar has just signalled it’s in bear mode. the 50dma has crossed back below the 200dma. Going back through this, and the last 2 dollar cycles you can split each cycle into 3. Each is clearly labeled on the following 2 charts going back the 1960’s. It’s as simple as green-orange-red, green-orange-red, green-orange-red. You get the idea…
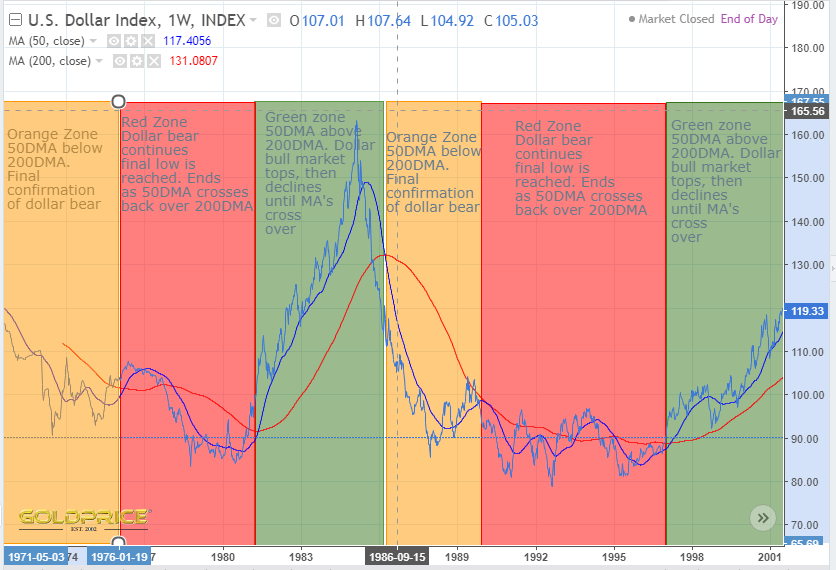
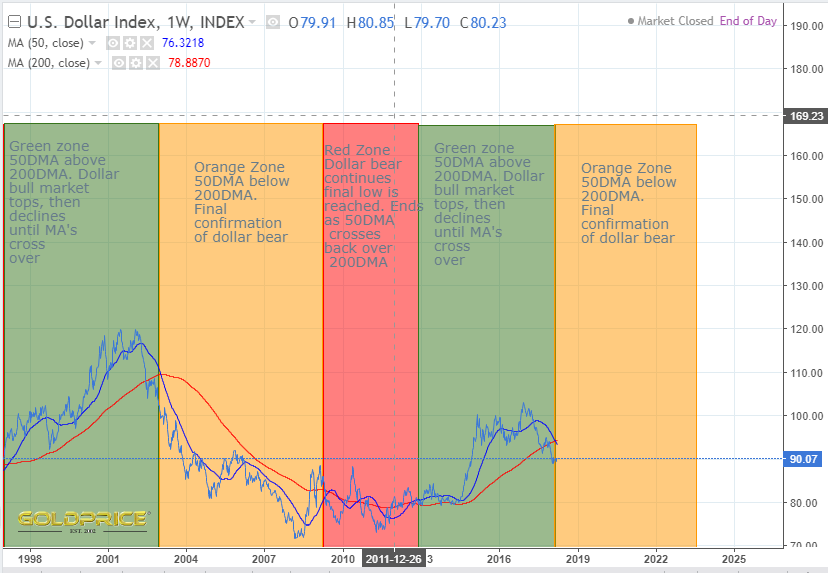
This chart pattern is literally shouting dollar bear at you. If you can’t hear it, you need to get the wax out of your ears. Can the dollar reverse and go up ? Yes, but only if this sequence is blown out of the water. Looking at the US fiscal position and its currency I just don’t see that happening. My opinion ? This pattern is happening for a reason. It’s not random, but symptomatic of global currency trends. Do your own research. Don’t accept anything without questioning and checking it first. I still haven’t seen or heard a single argument that accepts this historic pattern and explains why it wont follow the same descending path as the previous cycles.
Great info. Thanks Northstar.
Nice charts Northstar
I somehow assume that your proposed demise of the $US will somehow project itself into the PM space as possibly bullish?
The flaw I see is the timeframe frame 86 – 90, I continually put forward the question the largest drop in the $US With respect the PM market?
Do you have any explanation?
IMO it may have been physiological investors reaction to a blow off top in 81? If history rhymes where do you see investor sentiment after the 11 blow off top?
Hi RL. In itself a dollar drop doesn’t automatically mean PM’s will go up of course. It helps though. In my view it’s a case of looking at lots of separate pieces of evidence. Thst evidence points me to the dollar cycle pointing down and the gold cycle going up combined with things like the evidence from CHF/USD ratio and SPX/GLD ratio etc. Investor sentiment certainly isn’t good towards PMs at the moment – we need to climb thst classic wall of worry.
I would only repeat a famous quote by Joe Granville:
“If it’s obvious, it’s obviously wrong.”
That dollar pattern looks much too obvious for my liking.
http://strategicmoneyreport.com/obviously-wrong
I take your point Ken, but that in itself isn’t a reason to disregard. A heartbeat is an obvious pattern, but it tends to repeat. Until it doesn’t
Arrhythmia is much more common than most people think.
Thanks for your contributions to the board.
That’s a good article KenS.
It reminds me of the analogy of school teachers, they teach students to survive in the real world yet the teacher in most instances they have never left the school system – ever! Think about that School teachers have never been out of school? IMO the same should apply to economists rehashing the same broken economic theories for the last 100 years being taught by economic professors (school teachers). Now we are applying these economic principles in real time.
At what point does the economic herd admit they have been wrong for the last 100 years. The real question is how to profit from 100 years of compounding economic incompetence without being wiped out in the process?
Also worth noting that it’s far from obvious to most that the dollar will continue to fall. When several people (a few here as well) started warning about the dollar topping last year, not many seemed to think it was likely. So far, that call is right. We’ll know for sure soon. If the dollar is truly in a bear market, the 88 level will fail in the next few weeks.
Thanks very much for your postings today.
Very welcome MM. Still plenty of healthy debate going on. That’s what we need.
Along the same line lengthy article on collapse of Dollar.
https://www.goldmoney.com/research/goldmoney-insights/why-a-dollar-collapse-is-inevitable
Thanks Bikoo – a very interesting and informative read.