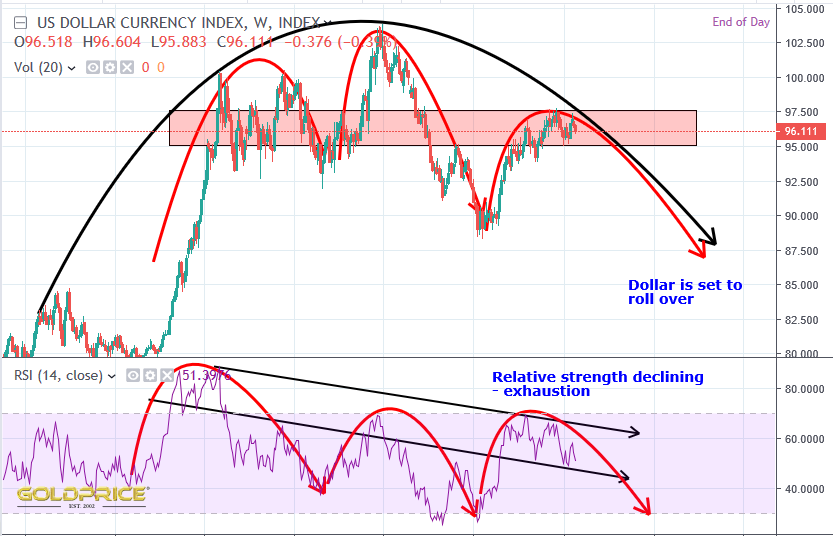
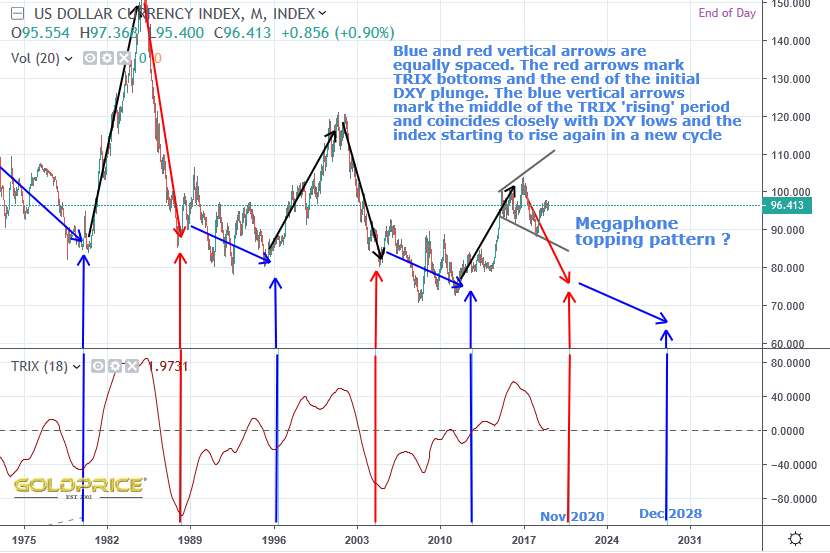
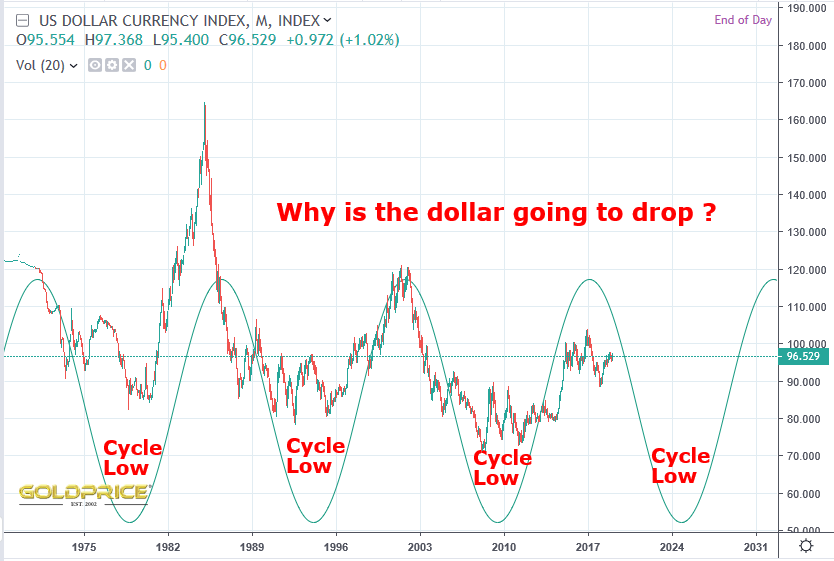
Dollar Very Long Term
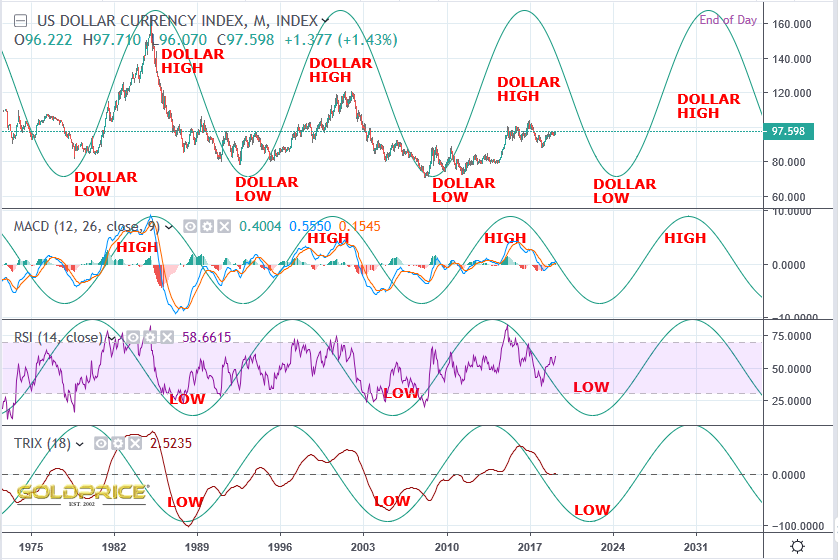
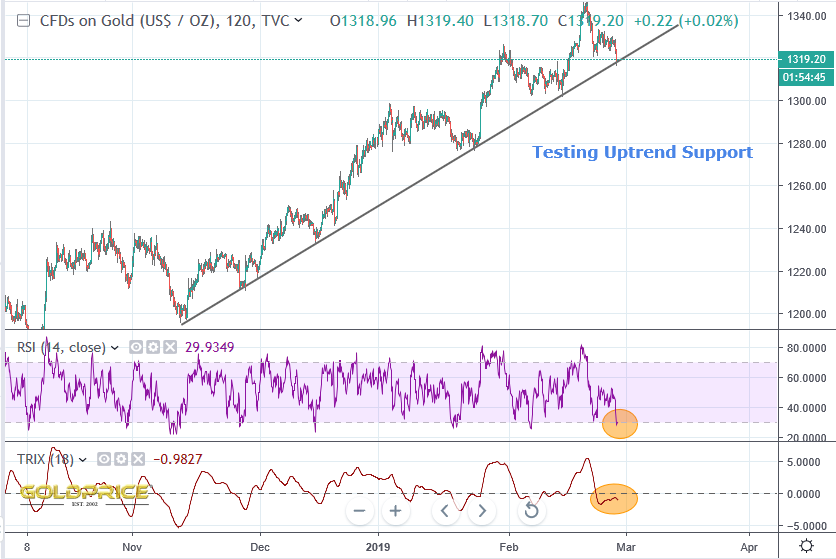
In a bull market, the surprises tend to be to the upside of course, so we could blast out of this bowl pretty much anytime. The indicators are turning, but will this current uptick prove short-lived ?
As measured in the World Currency Unit…
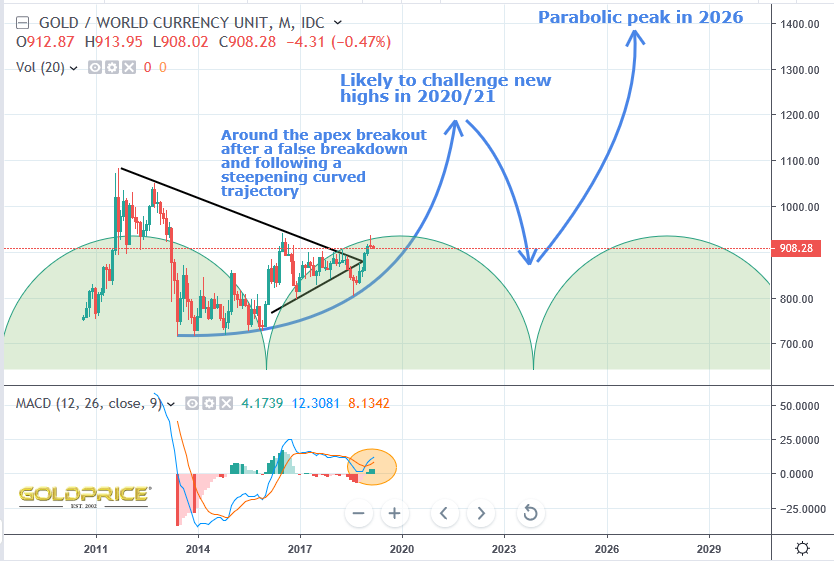
Gravity looks like it will take hold soon. Those declining indicators are a big clue.
Well, here’s how I see it…
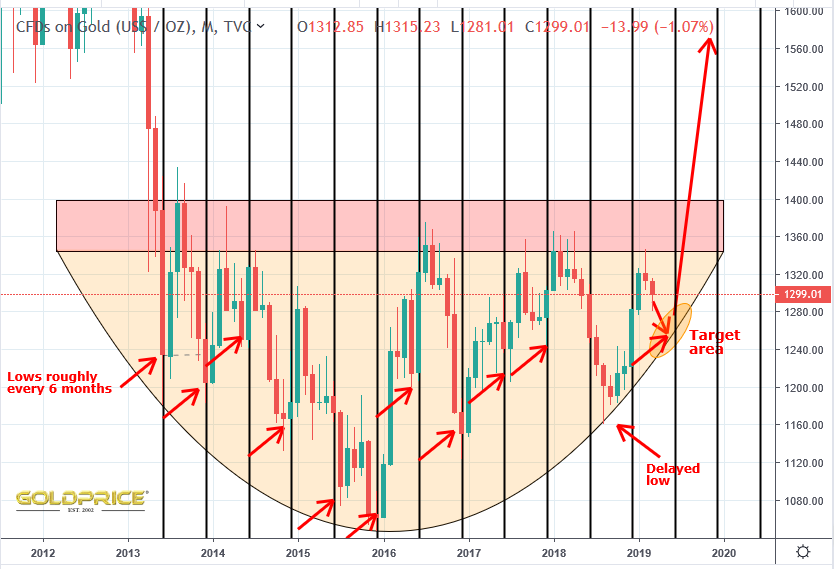
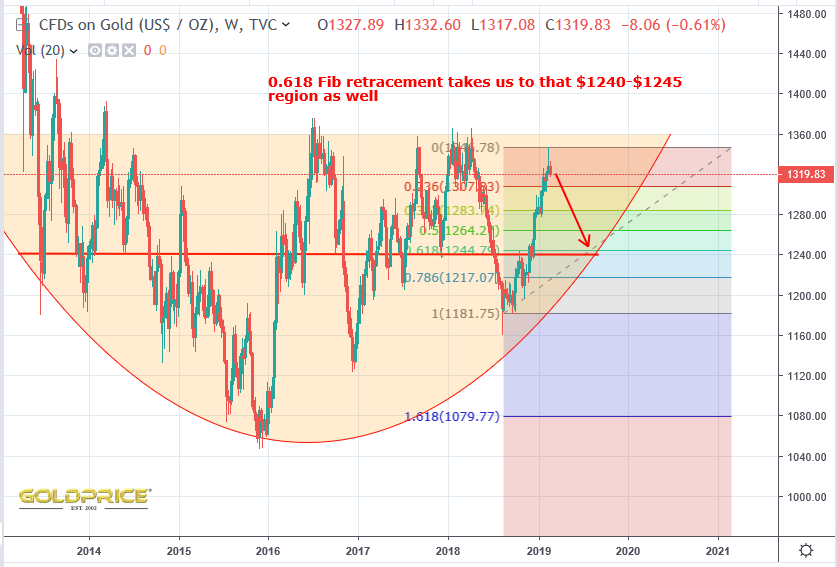
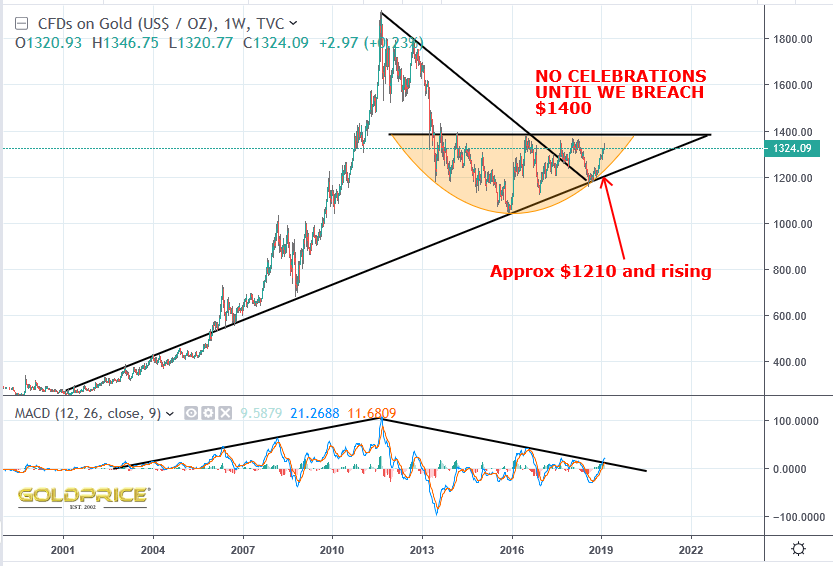
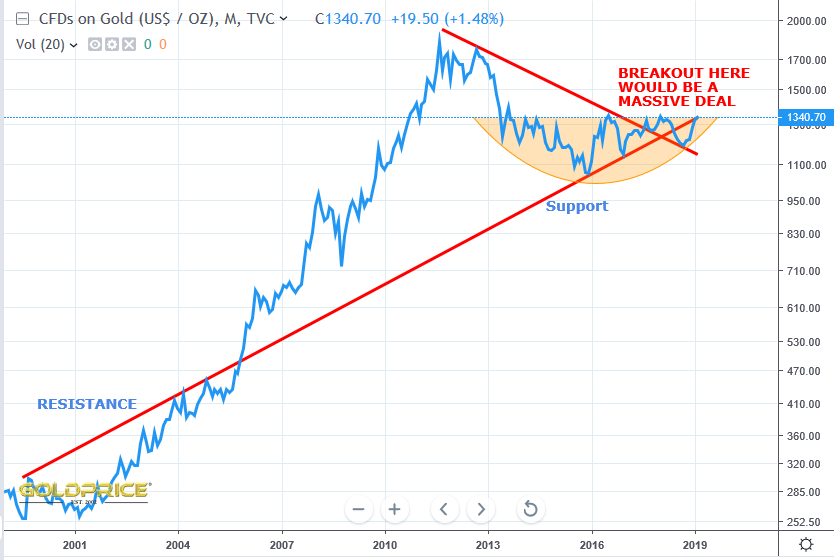
Not only does the horizontal support intersect the ‘bowl’ at $1240, but a .618 Fib retracement takes us to the $1240-$1245 region as well. Coincidence ?
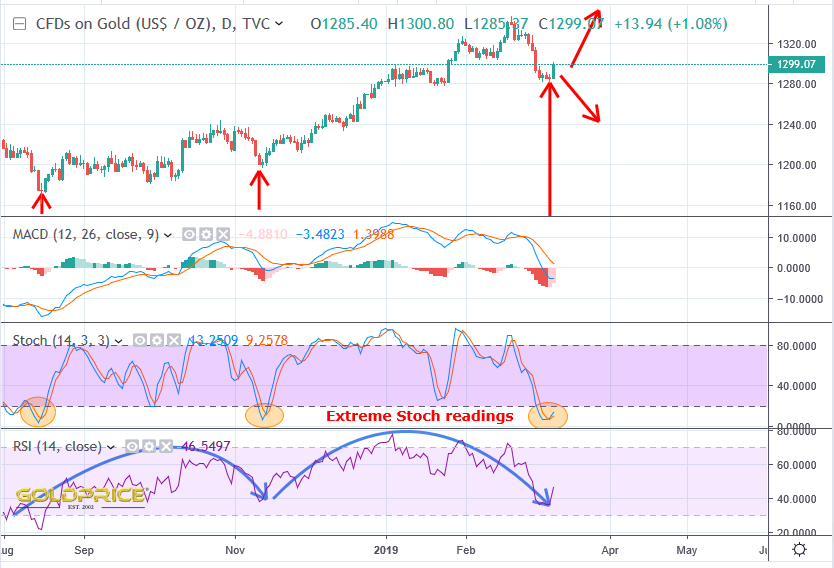
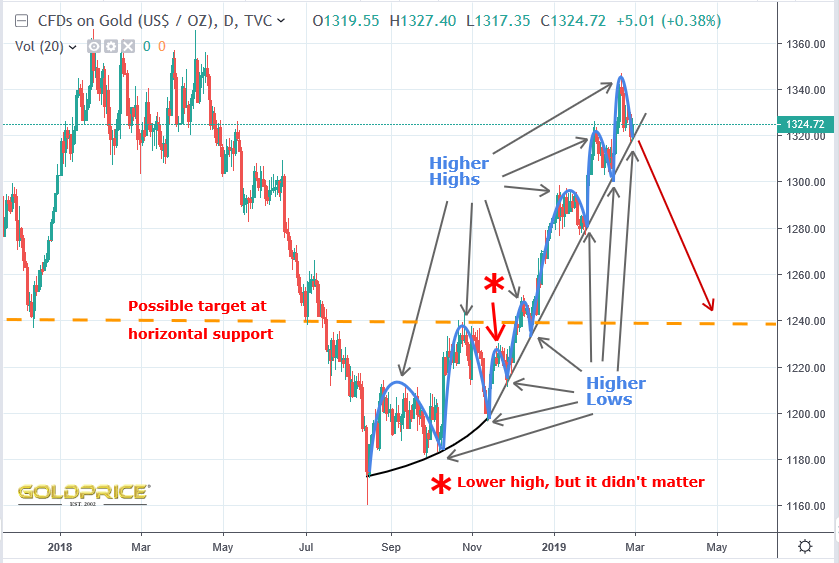
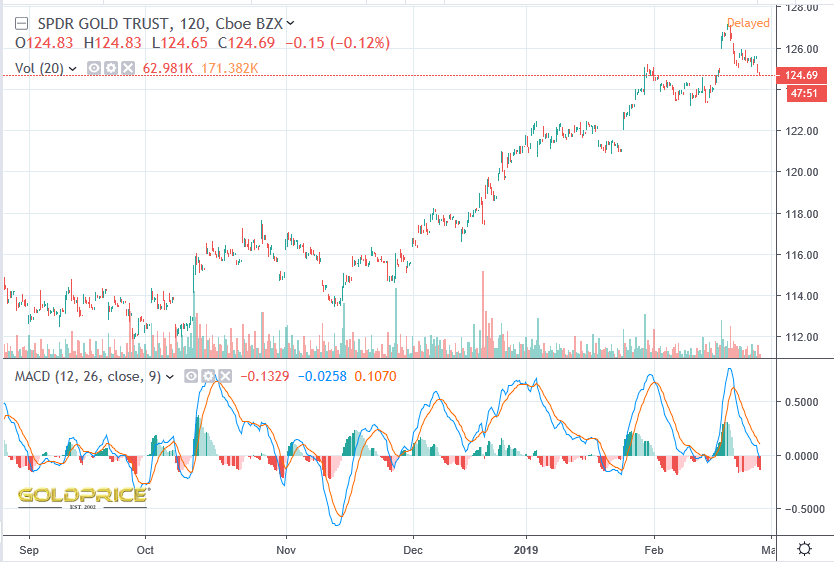
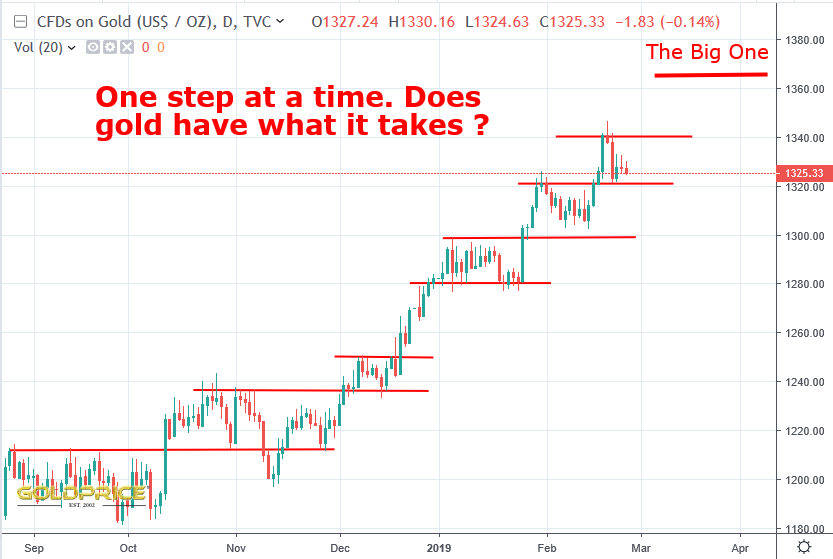
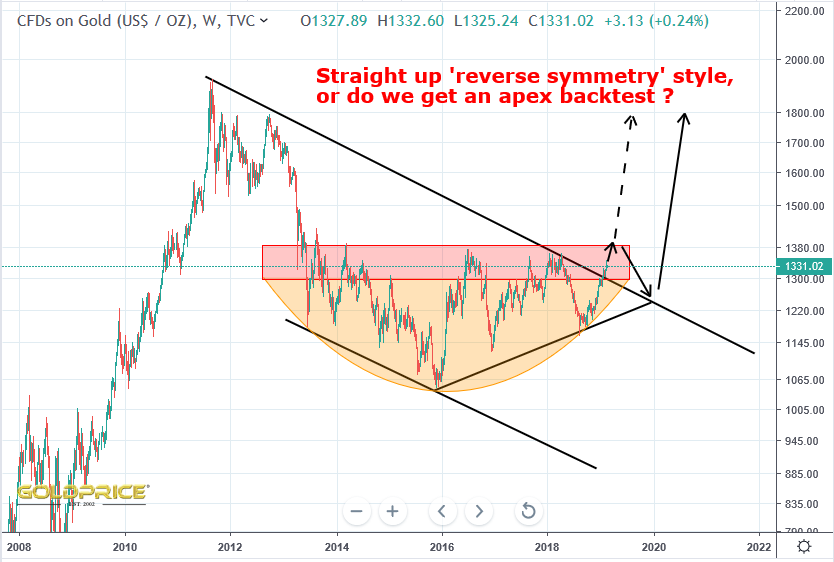
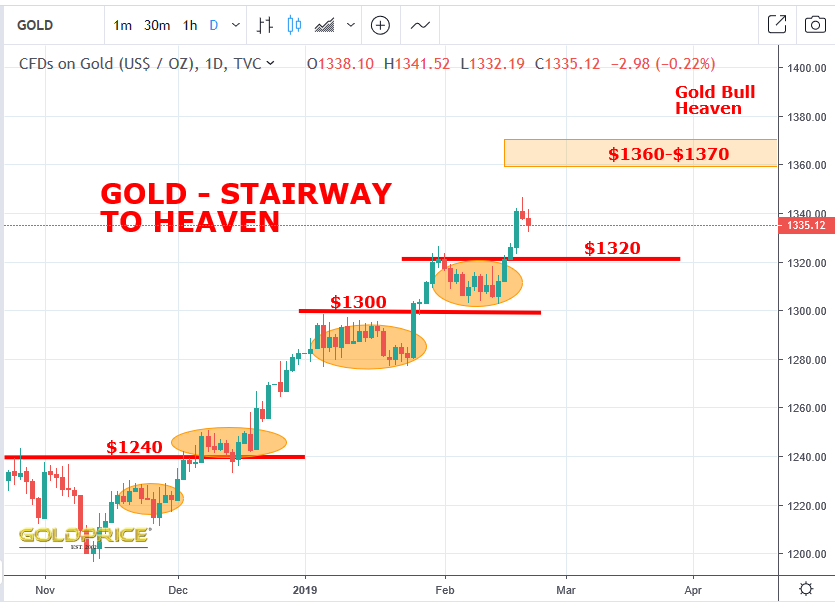
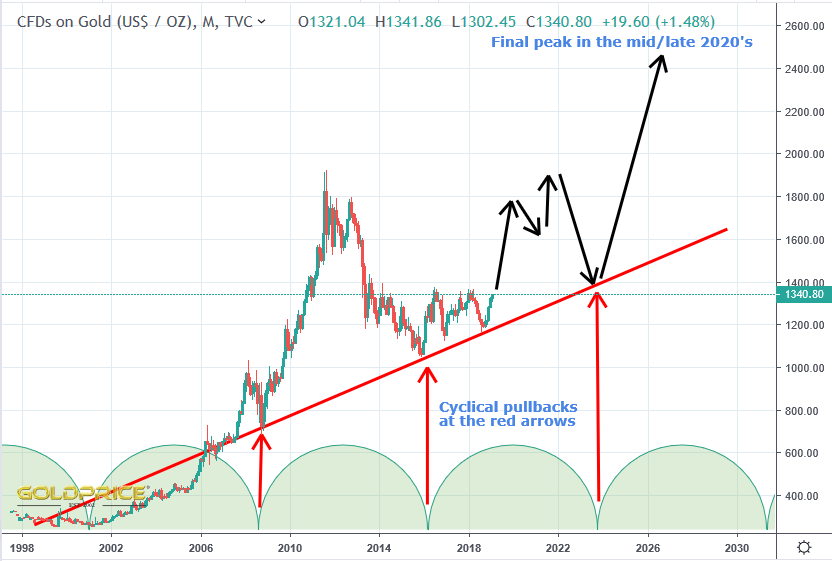
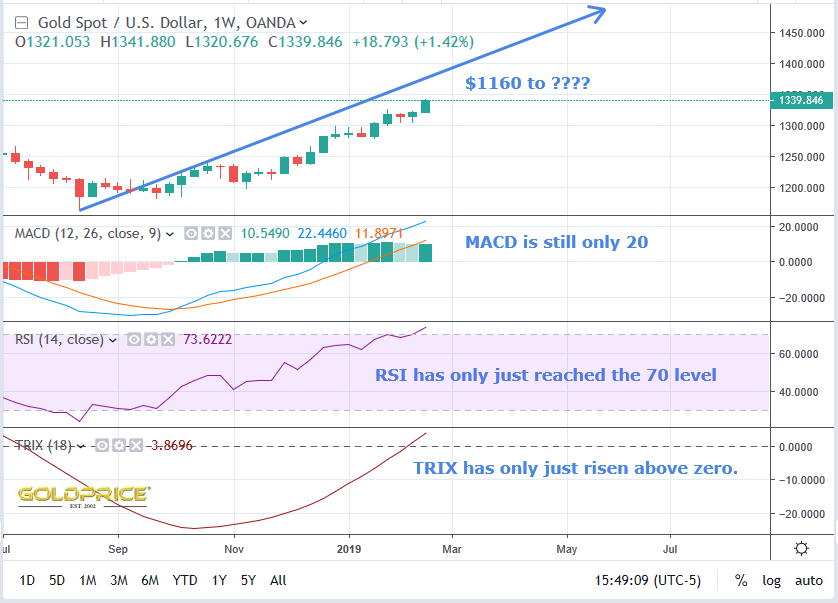
It looks like we’re going to need patience to see $gold finally breakout. It’s important now to keep the big picture in mind. First off, let’s have a look at recent price action and work on the assumption that we’re turning down towards an intermediate cycle low.
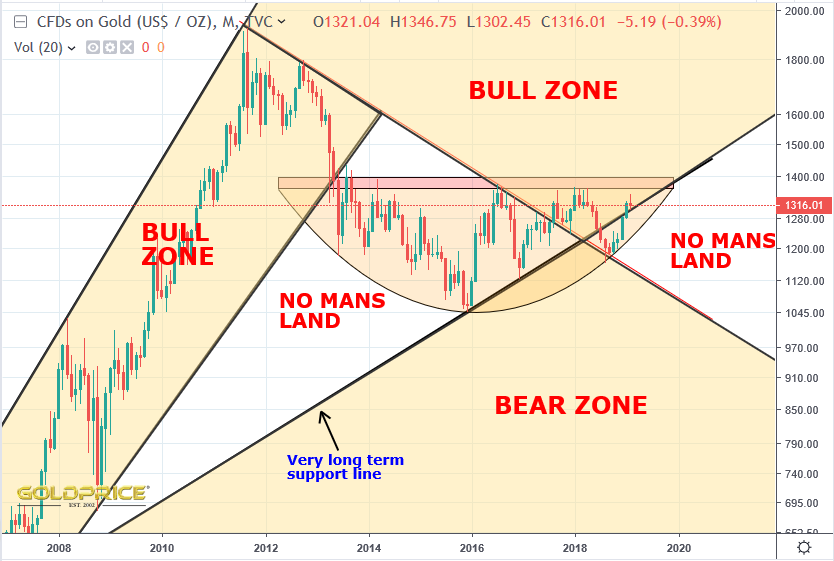
Interestingly that $1240 target coincides with the support provided by the ‘bowl’
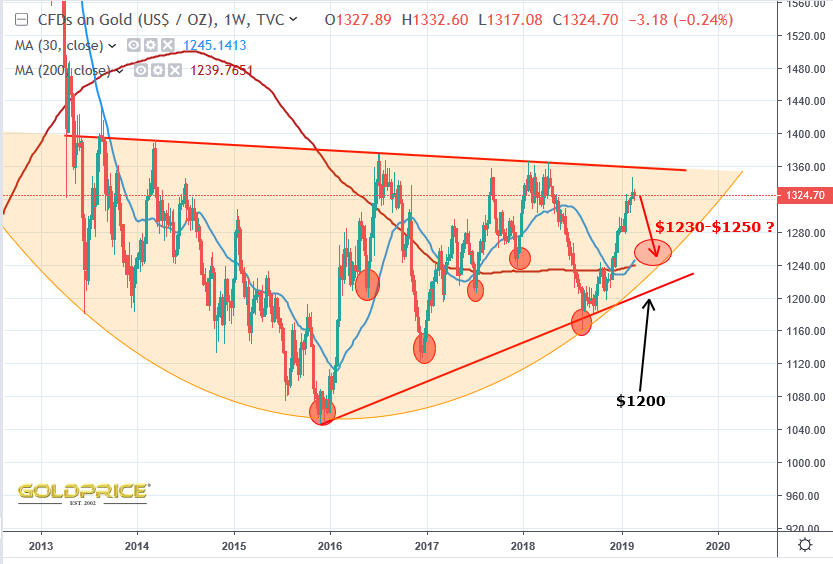
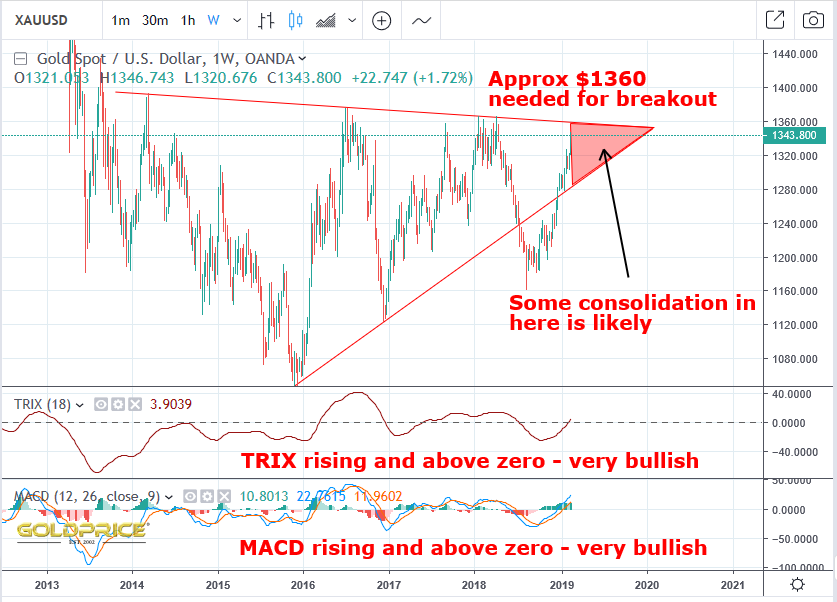
And finally, the big picture. Once $1360 is broken, $1400 will follow very quickly as the ‘penny drops’. Look out for that big cyclical drop into 2023 though.
If it fails it doesn’t mean it’s a disaster, just a more prolonged/pronounced correction/consolidation. Far more important support lines lie further down.
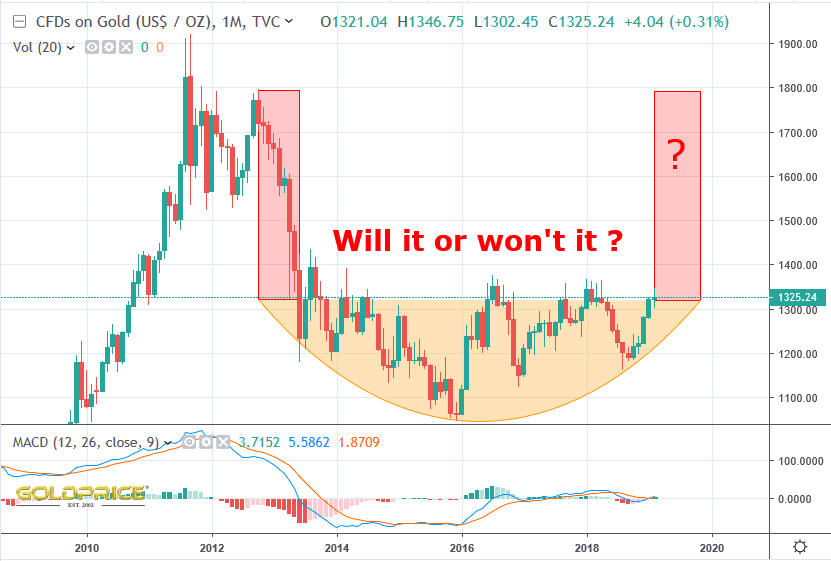
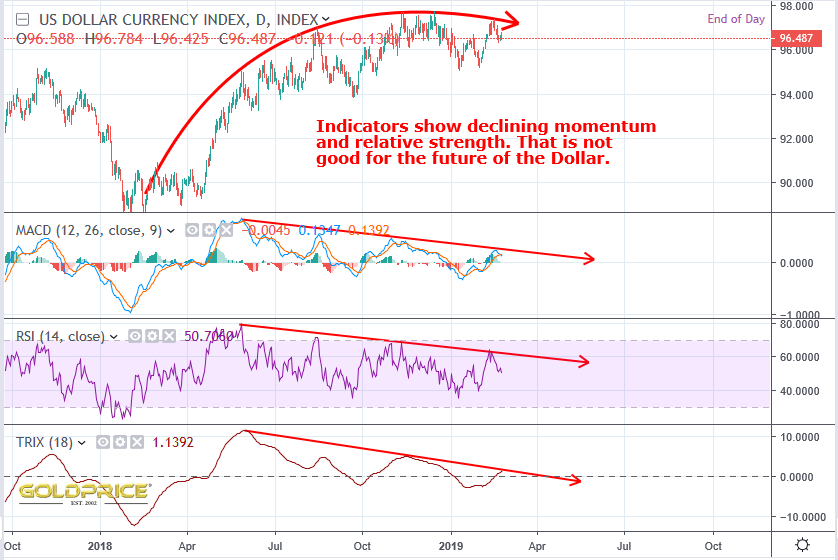
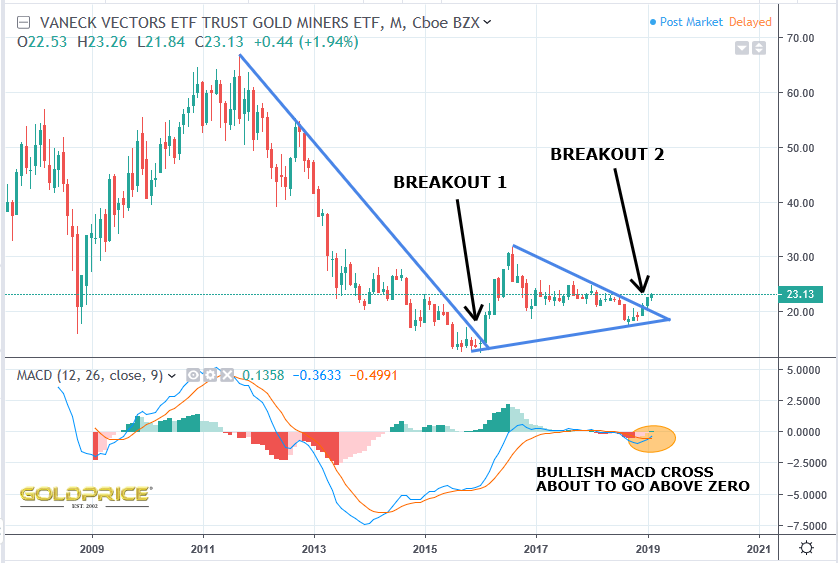
Highrollers earlier chart looks very bearish. It shows MACD trending down as price advances. Here’s my version of the same chart…
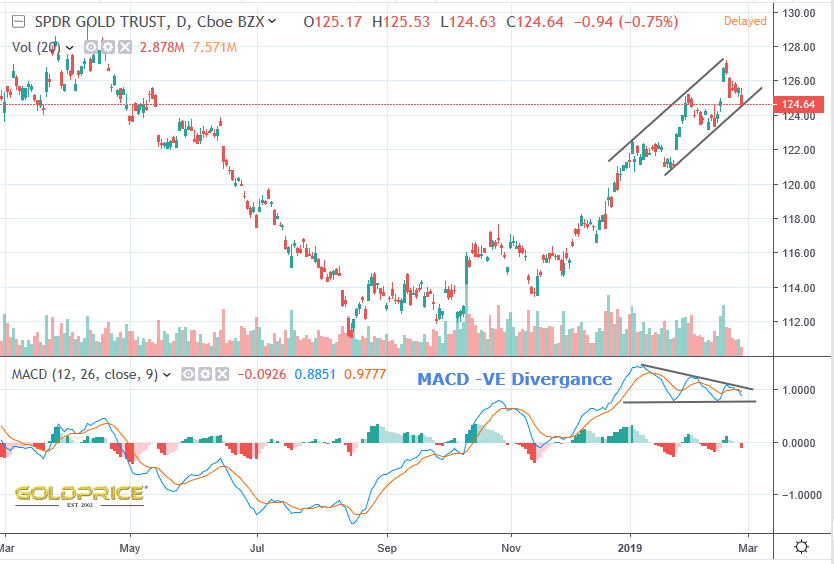
But, it’s worth noting that it isn’t the case on the 6 month view…
And when you look at the last 5 years it isn’t there either…
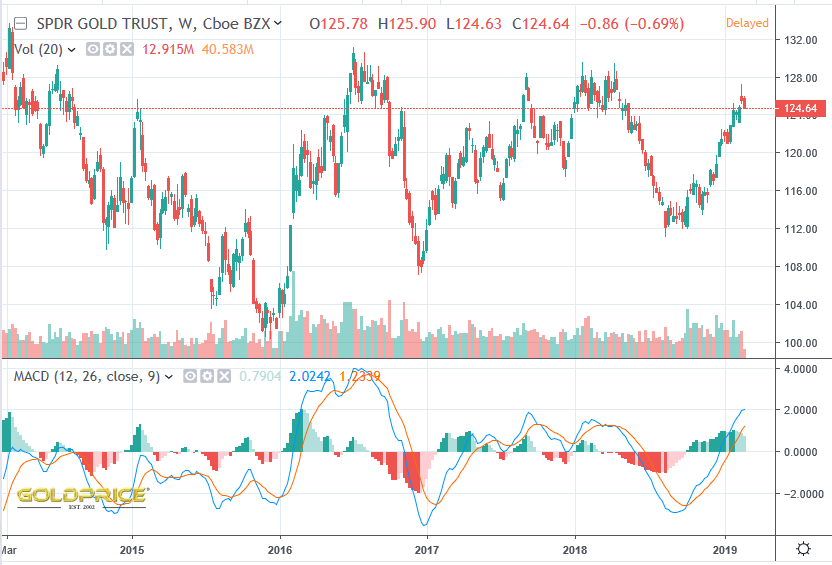
When you zoom out further, the picture is very different…
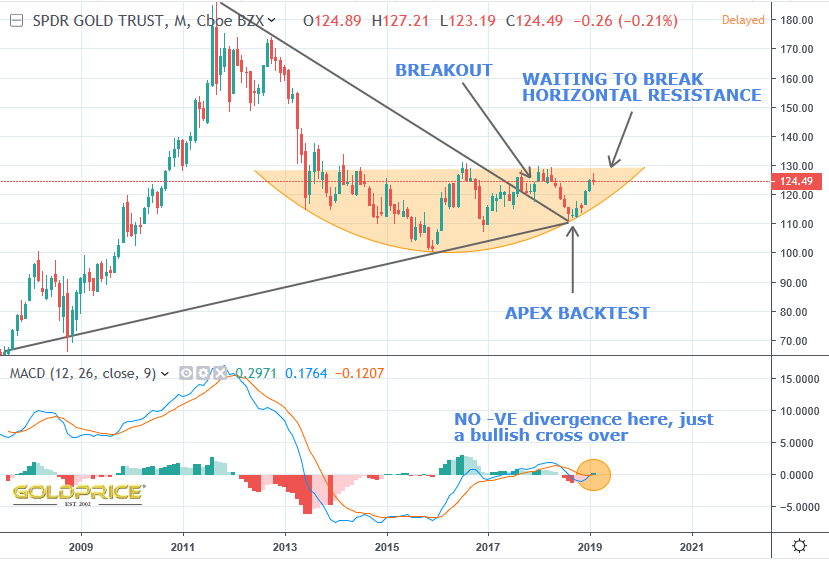
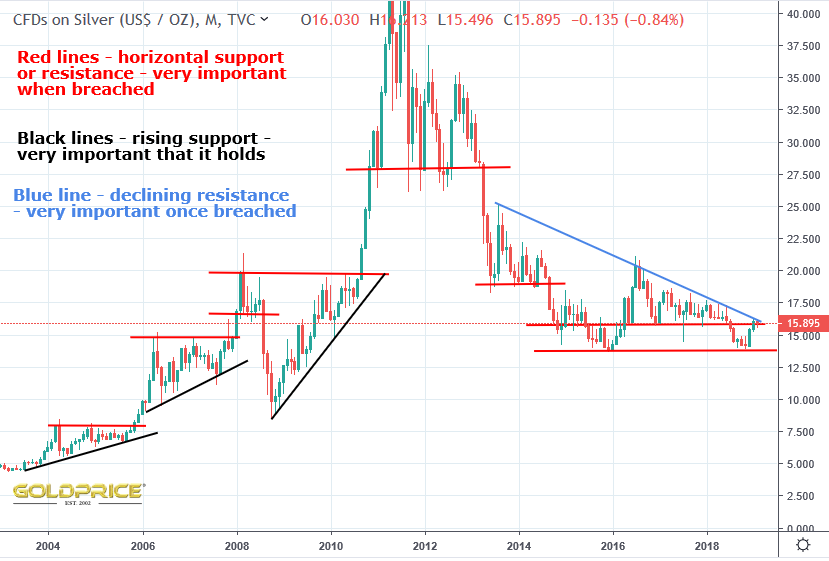
It’s always worth looking at the whole picture to retain perspective. A pullback/correction is fine, just as long as the support lines hold.
Jim Willie makes a few good points in this article http://www.marketoracle.co.uk/Article64273.html
The topping process (assuming it is that) has been very different this time around. It’s had an effect on $gold and pretty much everything else. Will it finally roll over ?
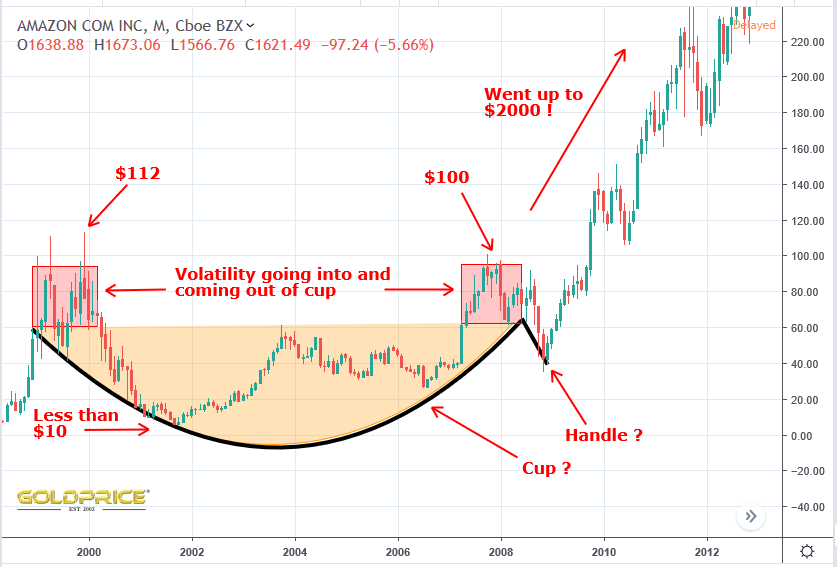
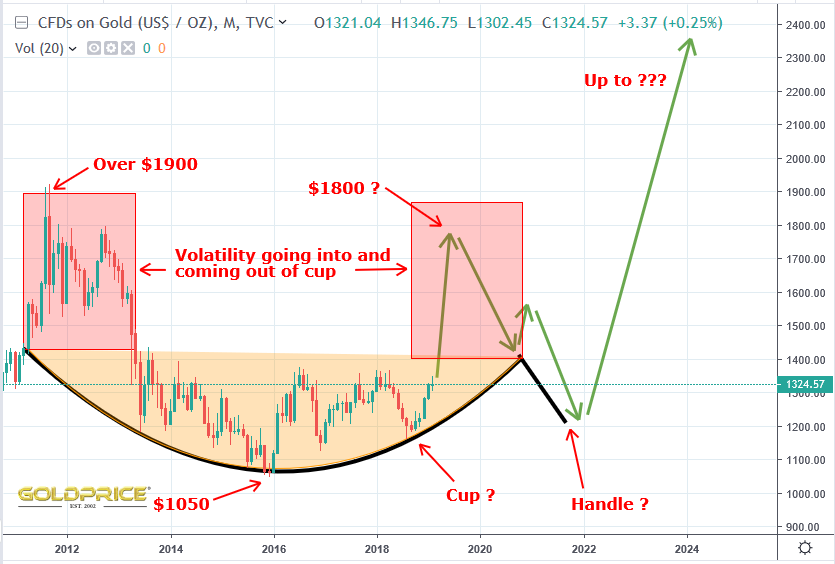
Spotted something on the Amazon price chart that looks very familiar. I’ve put it side by side with our current gold chart. What do you think ?
Nothing to do now but sit and wait whilst the bulls and bears fight it out…

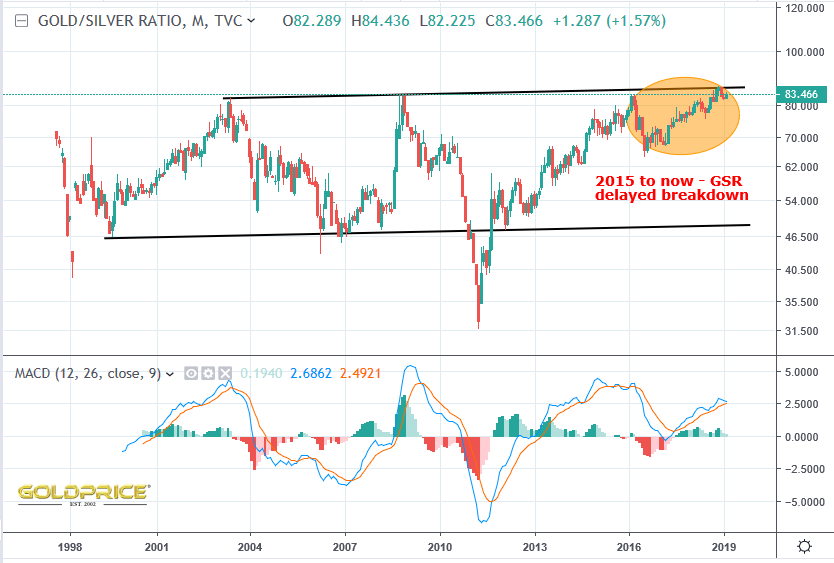
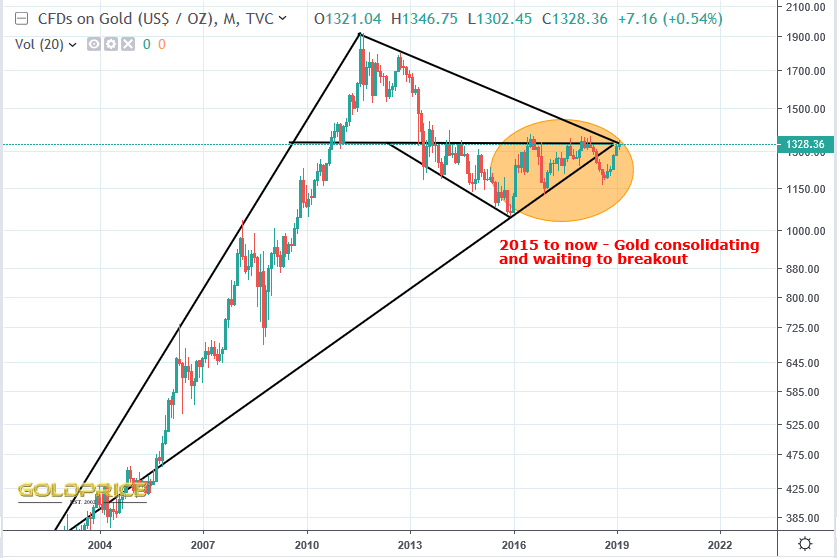
GSR, Gold price and the dollar – all have been building out a basing or topping pattern since 2015. I’d suggest that gold price being held back and the GSR failing to break down has a lot to do with the Dollar breaking above a very important resistance line in late 2014/early 2015. The question now is – which of these look like they’re topping out and looks vulnerable to dropping, and which looks ready to take off ?
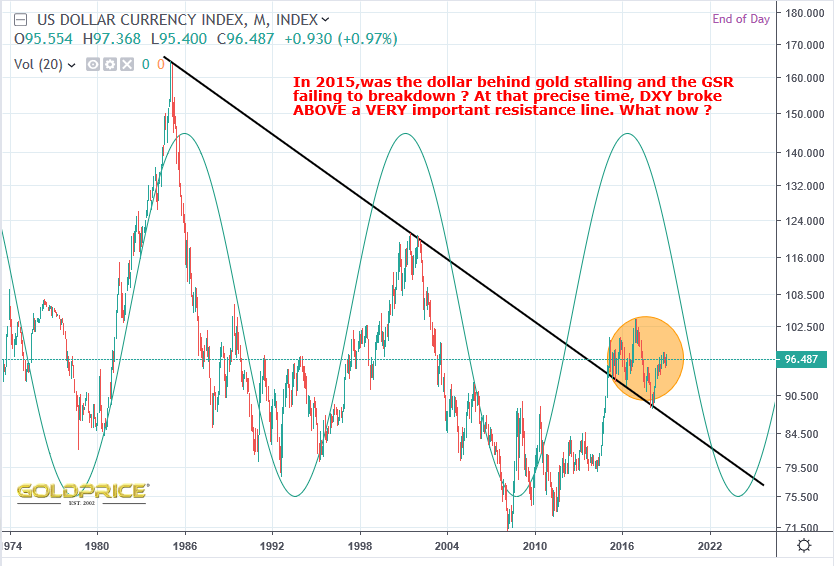
Hint: Here’s a bonus chart, if you’re still not sure
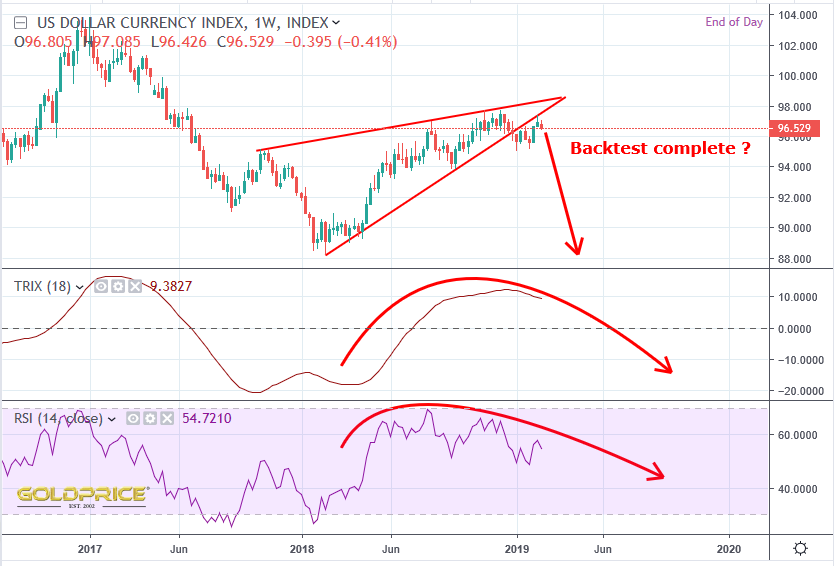
It’s my view that the failure of the Dollar to reach 98 over and over again is very telling. If it’s preparing to roll over, we’re about to see a big trend change.
Here’s another pattern worthy of consideration
Seems possible to me (assuming we get the all important breakout).
I keep remembering the global gold price breakouts (to new highs in some cases). That just doesn’t feel bearish to me, so I’m going with my thesis unless we start to break some of the support lines in the following charts. I marked a zone on many of my charts that we’re now up against. Nothing will be proven unless we break crucial support or climb clear of $1400. Wall of worry ?


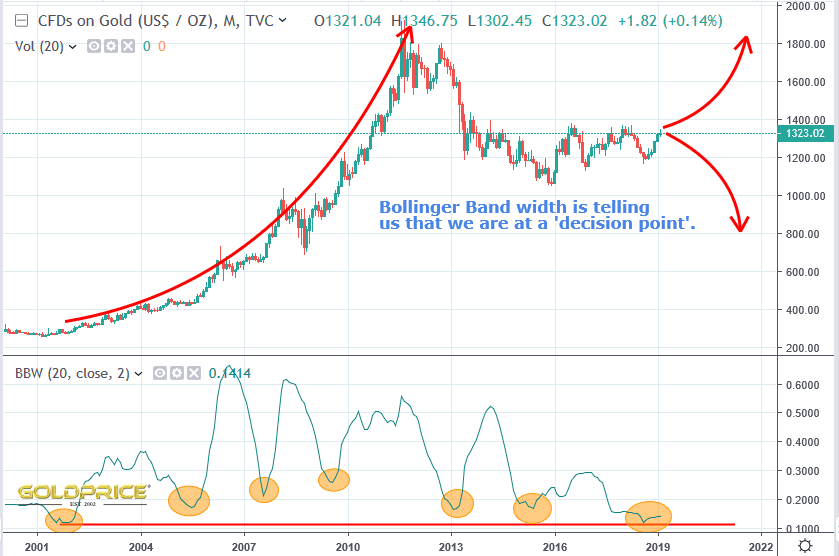
A compression of the Bollinger Band width is strongly suggestive of an approaching ‘decision point’. We know that we’ve hit the ‘turbulence zone’ I’ve been talking about for some time. A pause/consolidation/pullback here is healthy, but we need to watch support lines, so my next post will do that.
Hopefully this chart might explain why I think we are a hugely important point for silver. Declining resistance meets a zone of horizontal support – right here. I’m not sure what’s controversial about that.
The outcome of this bull/bear battle, right here could well define the silver market for a long time to come. Like gold, silver has broken through this resistance in many global currencies, but still has a lot of catching up to do.
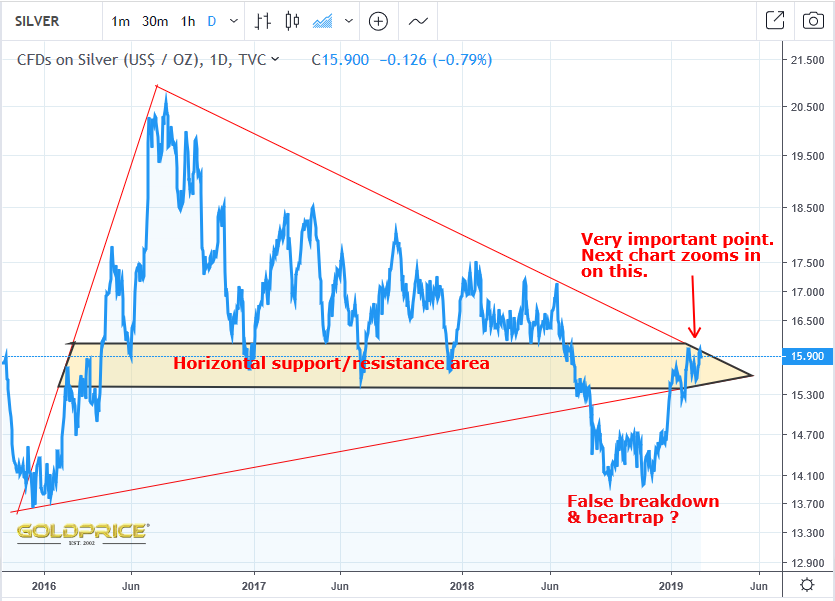
So close now. Will the bulls prevail, or has it all been a mirage ? We’re going to find out soon…
This was a big learning point for me. My original investment a few years ago went up from about $3 to $20, then plunged, and I got out at about $10 if memory serves me correctly. Anyway, I got back in again a while back and it’s up 10% today on some pretty important news (in terms of getting a mine actually built) https://www.juniorminingnetwork.com/junior-miner-news/press-releases/987-tsx/ndm/58467-northern-dynasty-us-army-corps-of-engineers-releases-draft-environmental-impact-statement-for-alaska-s-pebble-project.html#.XG20YfovmEg.twitter
We’ll find out soon…
Energy Fuels…


Not a recommendation – just an observation
Not good https://tradingeconomics.com/country-list/government-debt-to-gdp
$22 trillion debt, approximately $20 trillion GDP, so well over 100% now. That’s one very good explanation for de-dollarization and why the Dollar is going down into its cycle low. Way down.
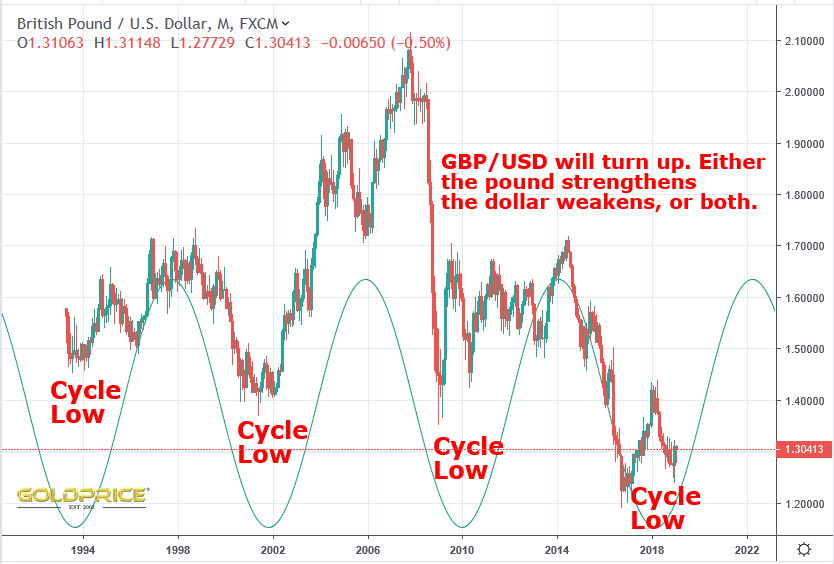
The dollar is king. It’s the worlds reserve currency. I’m not going to pretend I know the reasons for certain, but I can read what the charts are telling us. Over 22 trillion debt, a cornered FED, a president who is unpredictable, and the rise of Asia are all factors. There are many others. I don’t much care. The charts makes it blindingly obvious what is most likely to happen next (not 100% guaranteed – but most likely). A final dollar surge IS possible, but if it were to happen, I believe it would be short lived. Here’s the USD and GBP/USD charts…
It’s getting late here in the UK. Night all 
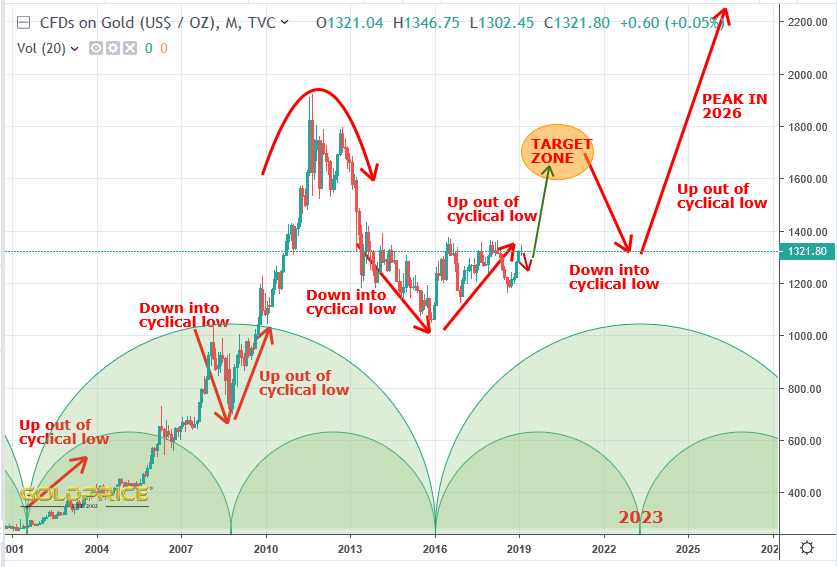
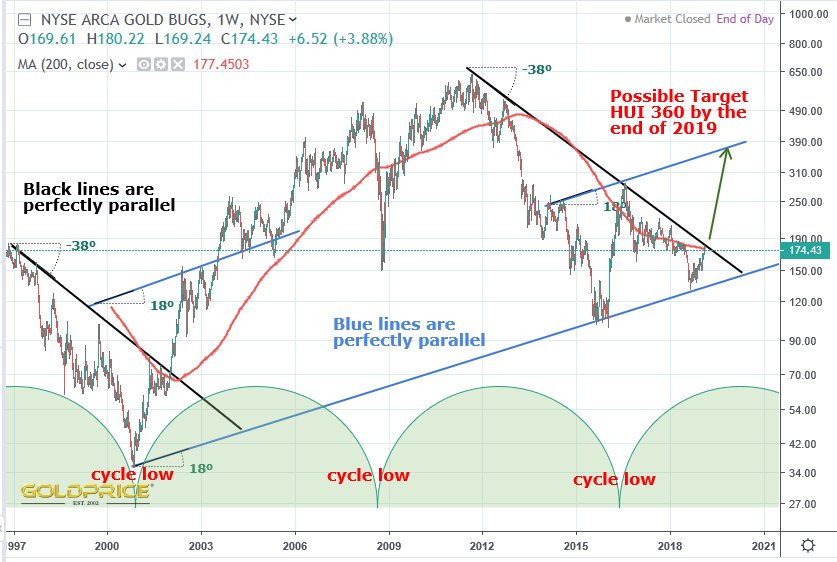
A question I’ve recently been asked. Cycle analysts have the answer. Asset classes of all sorts have a cyclical nature. The dollar is heading much, much lower in this cycle. I’m still aware of the small possibility of a final pop before the plunge, but I view that as a low probability. The gold cycle is doing its thing now. The chart below gives a rough and ready overview. Don’t take the gold projection too literally, but it works as a rough guide.
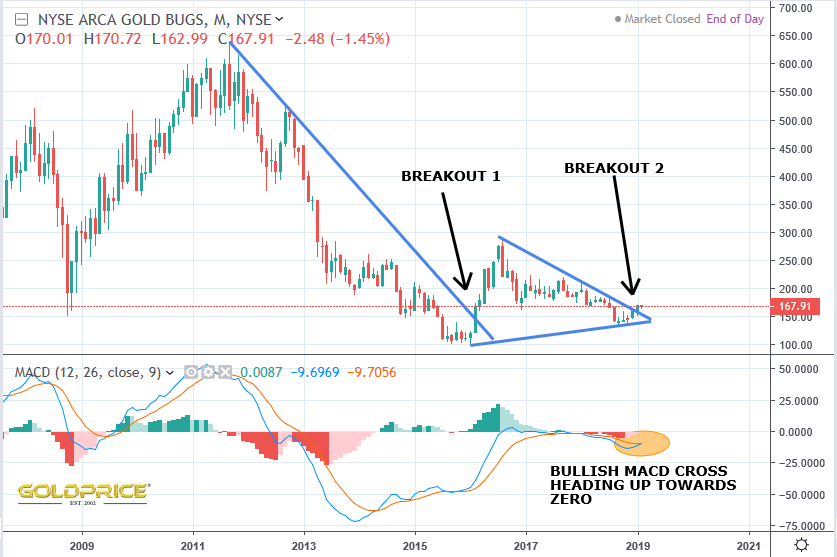
Both have zones of horizontal resistance, but the big breakout from the descending resistance is already behind us…
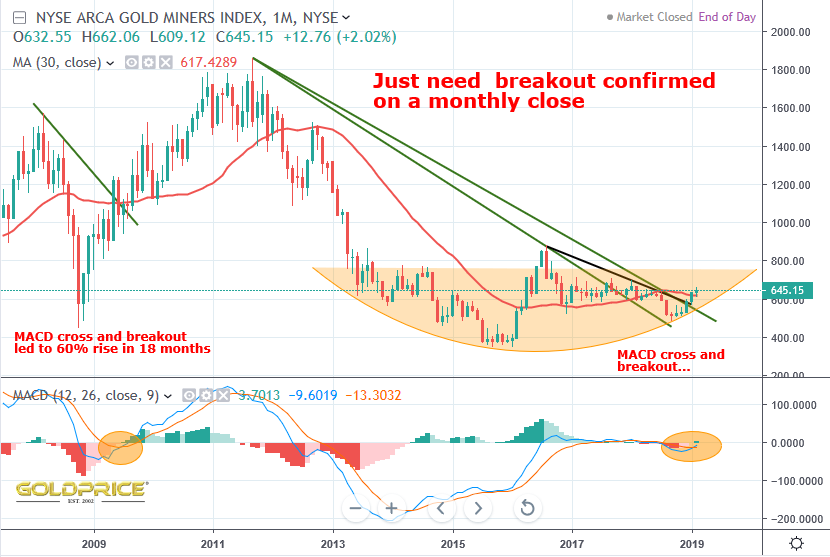
I took a look back at the big 2016 rally. Bear in mind that that was not a breakout move, just part of the bottoming process. As such, the current move could be stronger and longer (unless the whole thing collapses in a pile of dust – pun intended, lol).
This is 2016 and now side by side. Compare and contrast.
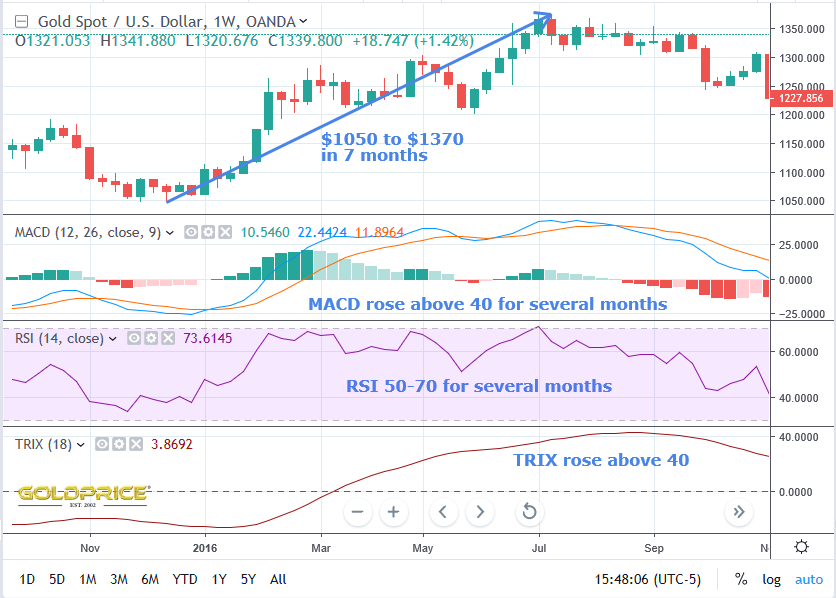
We may just burst through the $1350-$1400 zone. It really wouldn’t surprise me at all. Alternatively, we may consolidate around or just above the current level for a while, with a modest pullback possible. With breakouts already achieved in so many major global currencies (including the hugely important Chinese Yuan and Indian Rupee), upward pressure must surely be huge.