This is much more than an ordinary gold bull market!
A few months ago I contributed an article to the ‘tent’ in which I took issue with several analysts who were suggesting that with Elliott Wave analysis they could project the future of the current gold bull market.
The problem with their approach is that ‘EW analysis is at best applicable to a slow moving market’. Even then it is more effective in hindsight!
EW analysts keep warning you about the ‘scary #4 down wave’ that lies ahead.
We are currently seeing the most powerful gold bull market in the past 100 years! I was a trader/analyst during the 1976 – 1980 gold bull market, and the current bull is much more powerful.
The current gold bull market compares to events in France in the 1790s and Germany in the 1920s and Zimbabwe in 2008!
Gold Bull #1 during the last 100 years ran from 1970 to 1980, price rose from $100 to $850, a multiple of 8.5. Bull run #2 went from 2002 to 2012, price rose from $250 to $1,900, a multiple of 7.5. The current bull market started in 2015 at $1,000.00. Using the average of the last 2 bulls, we come up with a target at $8,000.00. Due to the current government deficits in nations all over the world, the $8,000.00 target will turn out to be but a stepping stone!
Next up is GDX the gold miners ETF which just a few days ago produced a rally, at the fastest pace in its history!
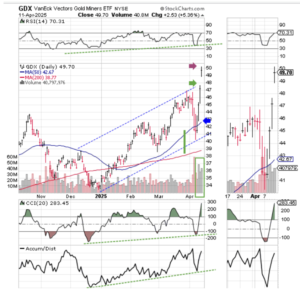
Here is a chart from our weekend report that shows the GDX gold miners ETF rising inside the blue channel, ending the week with its best four day performance, in many years, – probably ever! The rally that started at the blue arrow called for a target at the green arrow. In the event, price ‘jumped the creek’ and closed at the brown arrow. The green box shows that volume is supporting the rally. Instead sliding back into the blue channel, price appears ready to continue on its new track on Monday, leaving a ‘gap’ behind.
Next up is the daily gold chart as at 4 pm Friday.
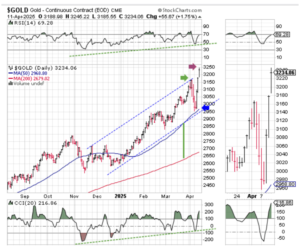
Here is the daily gold chart from our report of Friday April 11th. Once again we see price ‘jumping the creek’ at the green arrow (which was the target for the rise from the blue arrow). The supporting indicators are positive and the green vertical bar shows Moving Averages are in positive alignment and rising. The EW people will be warning you to expect a big drop based on their ‘voodoo’ analysis. Disregard them and enjoy this ‘once in a lifetime gold bull market’.
r the gold price. Without hesitation Jim answered $25,000.00!
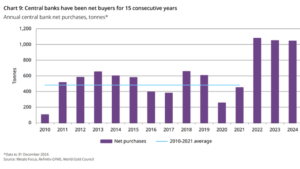
My third and final chart for this article shows demand for gold on the part of the Central Banks of the World. The sources for this chart are at the bottom.
Please do your own research and due diligence. Peter Degraaf is not responsible for your trading decisions. He produces two reports every week at his acclaimed website, peterdegraaf.com (the number of visits to the website is in excess of 500,000). The reports mentioned above are available free of charge, at the website.
Excellent read, thank you for sharing this!
The sector rotation is becoming more evident every day.
I noticed the opening 60 seconds this morning (GDX) had nearly 1.5million shares trade and and the O H L C was flat at 48.63.
At 12:53 12.7million shares and the H L was a $0.07 cent span.
Thanks for your analysis. Three thoughts as I was just about to make a post regarding gold and will just comment here instead. First, I agree about the strength of this gold bull and the economic and geopolitical factors while always present, are much more intense and important this time in history. Second, in the short term, gold chart technicals are extremely overbought and could be signalling a correction. If you hold physical and aren’t trading futures it probably doesn’t matter. Gold stock laggards that have recently broken out should continue higher(such as NEM which I posted on this morning) just look for upside gaps to fill and or golds possible pullback to add on drops toward support. Third, even if gold does correct, Silver looks like it is ready to take the batton for the next leg higher in this precious metals relay race.
Thanks Chartsmaster.
I make it a point to visit the tent daily and always appreciate your analysis. My beef is with the Elliott Wavers who keep scaring new investors away with their expectation of a big down wave.
Thanks for the points you make here regarding simple pullbacks.
pd
Thanx for the info and link. Cannot agree more with the targets as the shitstorm hits. Just reposting some notes from Armstrong and one his posts. The events to blow are huge.\
Nearly HALF of ALL outstanding government debt among OECD countries and emerging markets and around ONE THIRD of corporate debt will mature by 2027. Our computer is showing PANIC Cycles in 2026 around the globe. The defaults come when you cannot sell the NEW debt to pay off the old.
On top of all of these, many emerging markets, including China and now even Canada, are issuing debt denominated in US dollars. The older issues have also lost on the foreign exchange. Carney in Canada has just demonstrated his true lack of understanding of financial markets. He dumped US Treasuries but then issued Canadian debt denominated in dollars. As the C$ declines, he will lose on the return of the foreign exchange as well. Even the OECD report found that the costs of borrowing through dollar-denominated bonds had risen from around 4% in 2020 to more than 6% in 2024,
rising to more than 8% for riskier, junk-rated economies nations.
I have been warning that we are approaching World War III as a distraction from the collapse of sovereign debt in Japan and Europe. The total outstanding government and corporate bonds globally have now exceeded $100 trillion in 2024, as reported by the OECD. As I have also been warning, the central banks have been neutered. They can no longer fight inflation by raising interest rates because government debt just explodes. Governments have NO INTENTION of ever paying off their debt. They think there is no end to this game.
Thanks for posting this well researched Analysis here Gold Relic
I know you have been charting the Gold market since long before most of us became interested
This sure seems like a powerful situation
Bookmarking your website
Thanks Gold Relic!