COAL via BTU
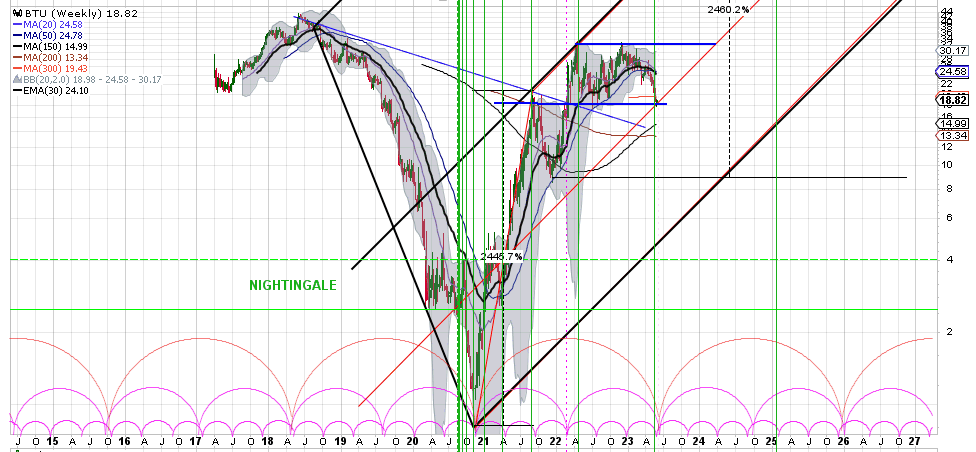
Charting COAL via BTU. Here 6-year weekly chart.
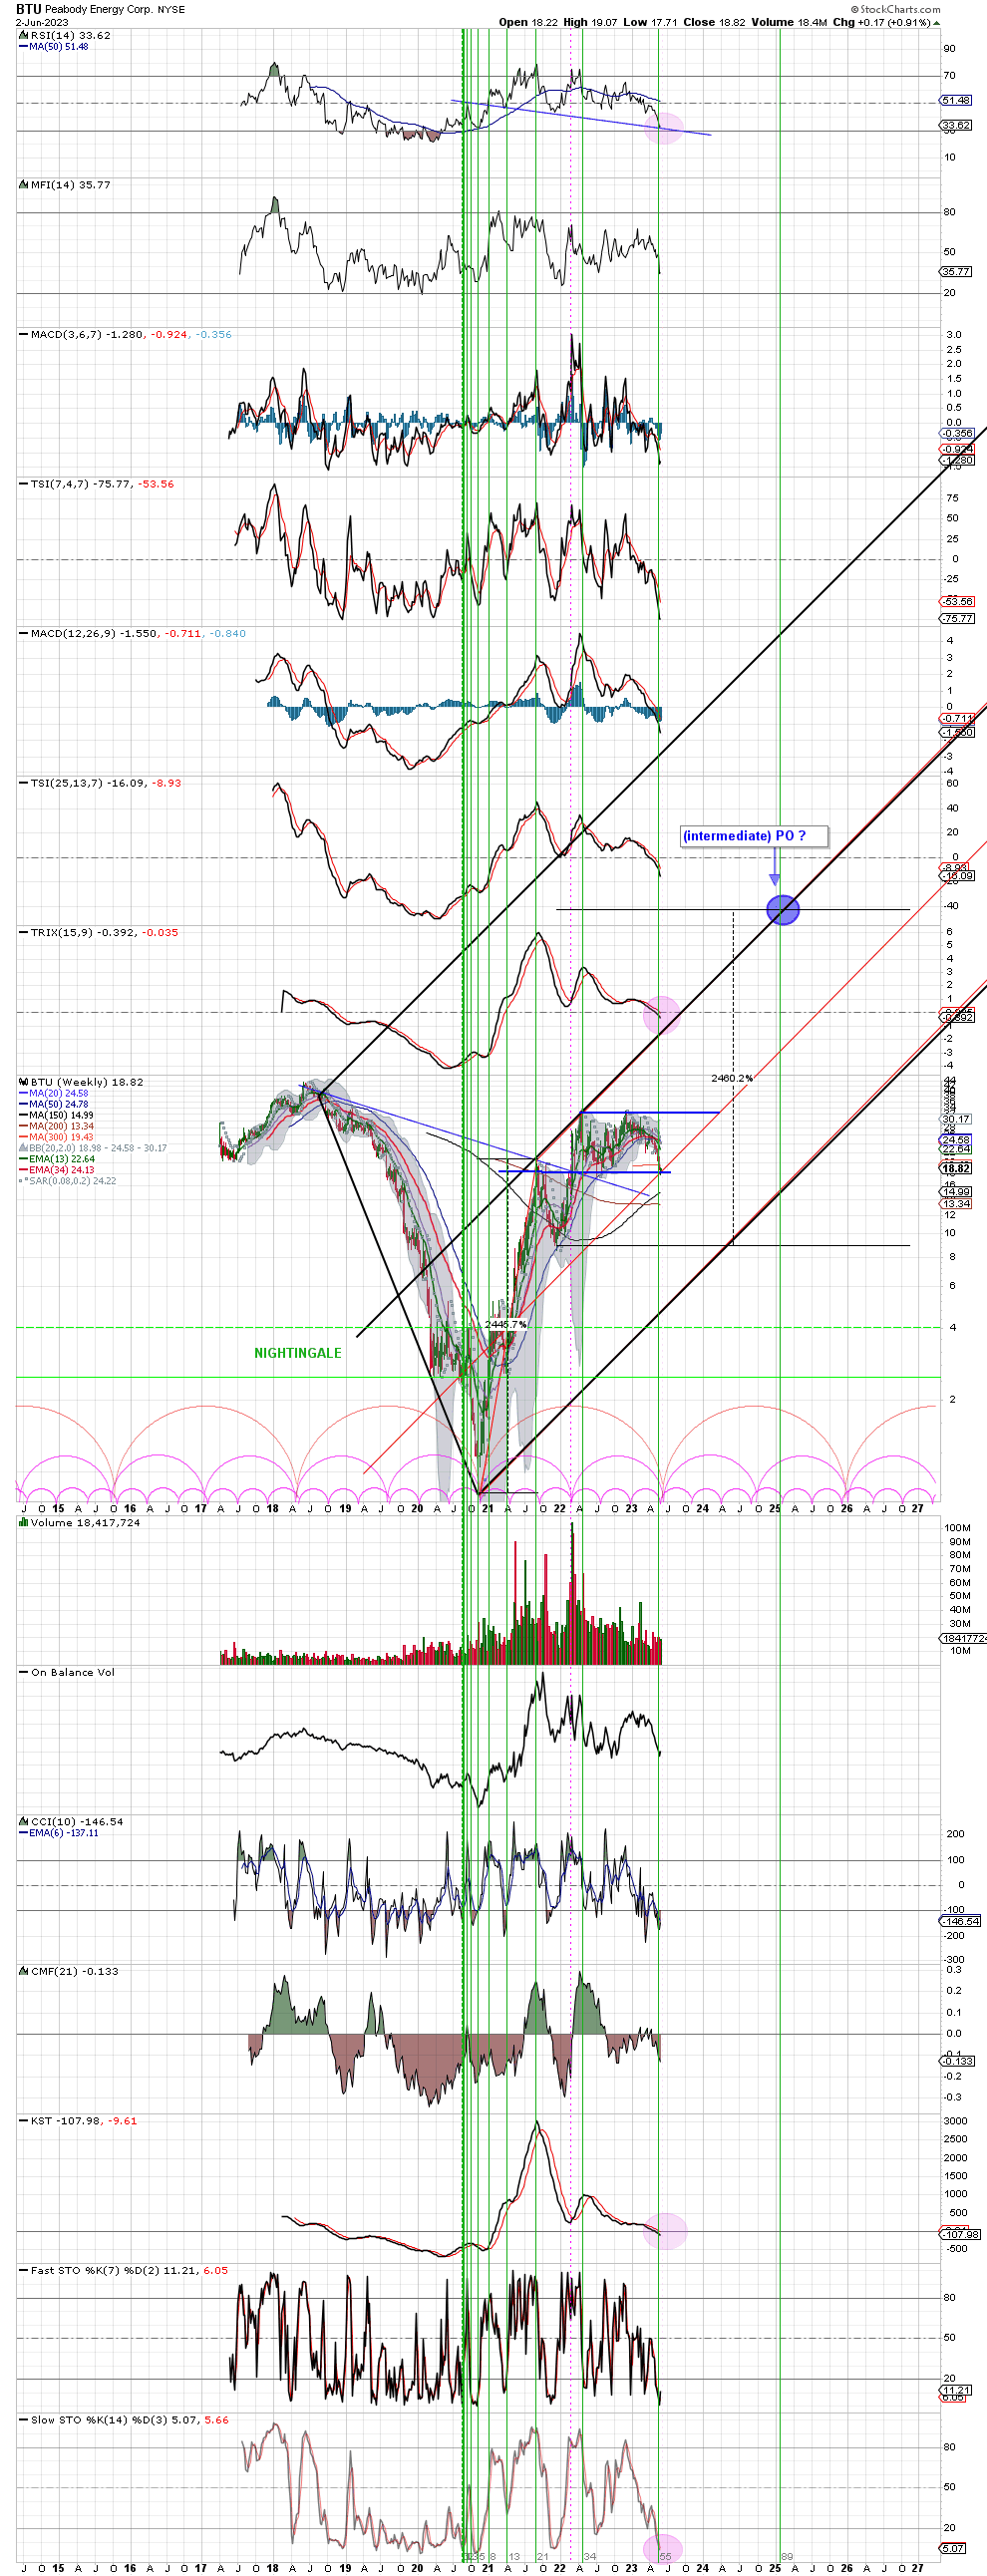
Despite the 2019-2020-CRASH, COAL made an astonishing BULL-RUN as BTU shows by 2461% increase in 12 months’ TIME (’20-’21). During 2022, BTU paused and did a necessary cool-off. At this moment BTU finds multiple support by a RED FORK which aligns with the LARGE BLACK FORK. Moreover, BTU finds support within a possible BLUE RECTANGLE. BTU is at a critical point (Make or Break) when considering the RED FORK and BLUE Rectangle. But when considering the indicators (see thumbnail) which shows ‘oversold’ conditions while RSI is at charted support and both TRIX and KST ‘could’ have completed its’ BT (back-test) at the ZERO-line …. then probability for BTU (and COAL in general) is to go HIGHER from here.
Although the charted cycles might look ‘off’, for now it is best I came up with. I withhold from setting larger cycles as such seems a bit blurry at this moment to foresee.
If measurement taken correct then (intermediate) PO (price objective) could become 221 when taken 2461% from 9.00 (see thumbnail). And such would be if the pattern would become HALFWAY where I will not rule out a (classic) 3 Elliot Waves (of potentially each 2461%. Could it? Heck why not in a World Out of Control.
Next GREEN VERTICAL FIB line comes January-2025 and could mark the next (intermediate) TOP; possibly @ 221.
IMO. DYODD.
Another fine chart. Many thanks, Nightingale!