Silver’s Breakout Price
As the decline in the price of Silver drags on, it’s downtrend line marks lower and lower breakout price points, the longer this continues. The chart shows that around 24, which is also where the 50 day mvg avg currently resides should be the first trigger point indicating a BO. There will be some resistance at 25 and 25.80-26 where the 200 day hovers. Given the protracted downtrend, it is quite possible that when the BO occurs, it will have such strength and momentum that the numerous points of resistance will be just brief pauses on the way back to and thru the high from last year above 30. The BO can occur anytime, but probably NOT before the month of September is over. Friday is October 1st. That would be a nice kickoff. 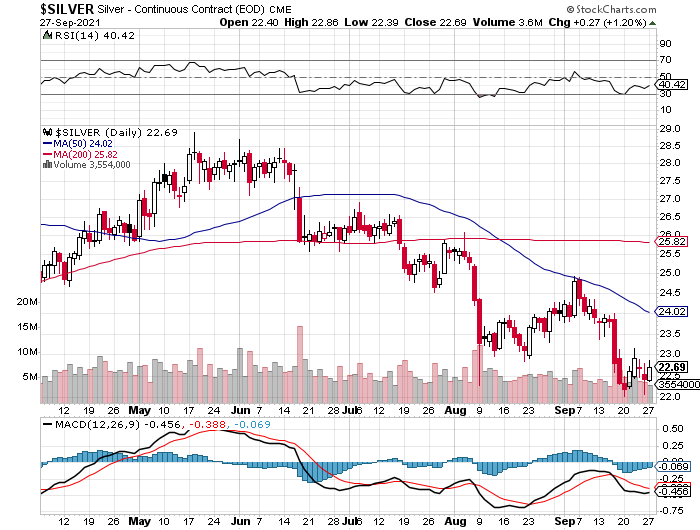
These stocks are indeed hard sold now and could spark a rally any day. But have not yet met my objectives on the downside. I do not think any rally to the upside calls for the proper course of action to play it. Myself I remain on the sidelines (in gold sector, short general market) If the GDX can reach 27 I think its worth trading an upside rally, however the ultimate bottom zone may be lower than 27. It’s a tough game this bottom searching, but a lot easier to play from the sidelines.
Below chart shows SILJ a bit over half way to its measured move
https://stockcharts.com/h-sc/ui?s=SILJ&p=D&yr=1&mn=5&dy=0&id=p66902417320&a=972625228&listNum=43
At this point in time I prefer an ALL IN approach. Plenty of physical, PSLV, MAG, HL, VLMGF, BKRRF topped off with leverage on top of leverage. Calls on AGQ. Don’t use leverage often but this is as good a time as any.
Tongue in cheek I trust?
Why tongue in cheeck? I haven’t used leverage in this sector up to this point. Now is the time, the risk reward warrants it. Of course the only part of the portfolio that is leveraged is miniscule but I want as much bang for the buck, therefore a limited number of calls on AGQ which is a leveraged ETF on the price of silver. Makes perfect sense and if it doesn’t break out before the calls expire it is minimal and worth the risk in my opinion. Not a recommendation for others just my take.