Analogous technical action in the miners…
I thought it might be fun to look at two high fliers–NVDA and AMD–to see if they can give us any guidance on what is at least possible in the miners.
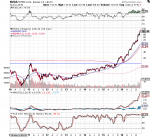
The first chart is NVDA, which made a peak back in 2011 and then based for almost 5 years before breaking out above resistance (denoted by the horizontal blue line) in late 2015. This chart also shows the 400 week Bollinger bands and the 55 week EMA. Notice how after breaking out above the upper Bollinger band in 2015 it came back to test previous resistance in early 2016 and then went parabolic. Notice also that the test in early 2016 also happened to test the upper Bollinger band and the 55 week EMA right as the 55 week EMA was crossing above the band.
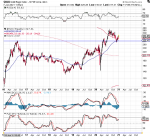
Now look at the HUI. Notice that it has broken above it’s base (denoted by the horizontal blue line) and has also managed to break above the upper Bollinger band. Like NVDA, it has also tested that previous resistance. Is it about to go parabolic? I think it’s possible, but I also think that while it could rally substantially in the next few months, it could come back down to test the 55 week EMA once it crosses above the upper bollinger band–that could be the last great buying opportunity before it does go parabolic.
AMD had a bit of a different basing pattern. But notice the relationship between the 55 week EMA and the upper 400 week Bollinger band and its break above resistance and backtest before going parabolic.
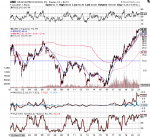
Now take a look at EXK, one of the strongest mid-tier silver miners over the last year. It think the reason for this is that it was playing catch up. It is just testing resistance right now. I expect it to break above that resistance imminently, but like AMD, I expect it to eventually test that previous resistance later this year. AMD basically tested its previous resistance over the course of 1 year before it went parabolic. It wouldn’t shock me if EXK is going to take a similar breather, so it will in all likelihood give back some of its recent outperformance when it peaks out in the next few months.
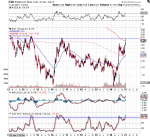
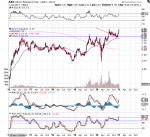
Here’s AXU’s chart. It looks more similar to NVDA’s and the HUI’s chart pattern than AMD’s.
Basically, while the parabolic phase may be beginning in the miners, I think it is just as likely that once this current rally ends, we will come back down to test the 55 weekly EMA one last time before an epic parabolic move ensues. We have already tested previous resistance in most of the miners, which suggests we have already started the parabolic phase. However, the 55 EMA has not yet crossed above the upper 400 week Bollinger band, which may be suggesting that we will get one more test of the 55 EMA this year before the parabolic phase begins.
Wow Nautilus
That’s some excellent analysis
Bring it on !
Much appreciated