US Dollar Chartology
This is how I see the US Dollar chartology.
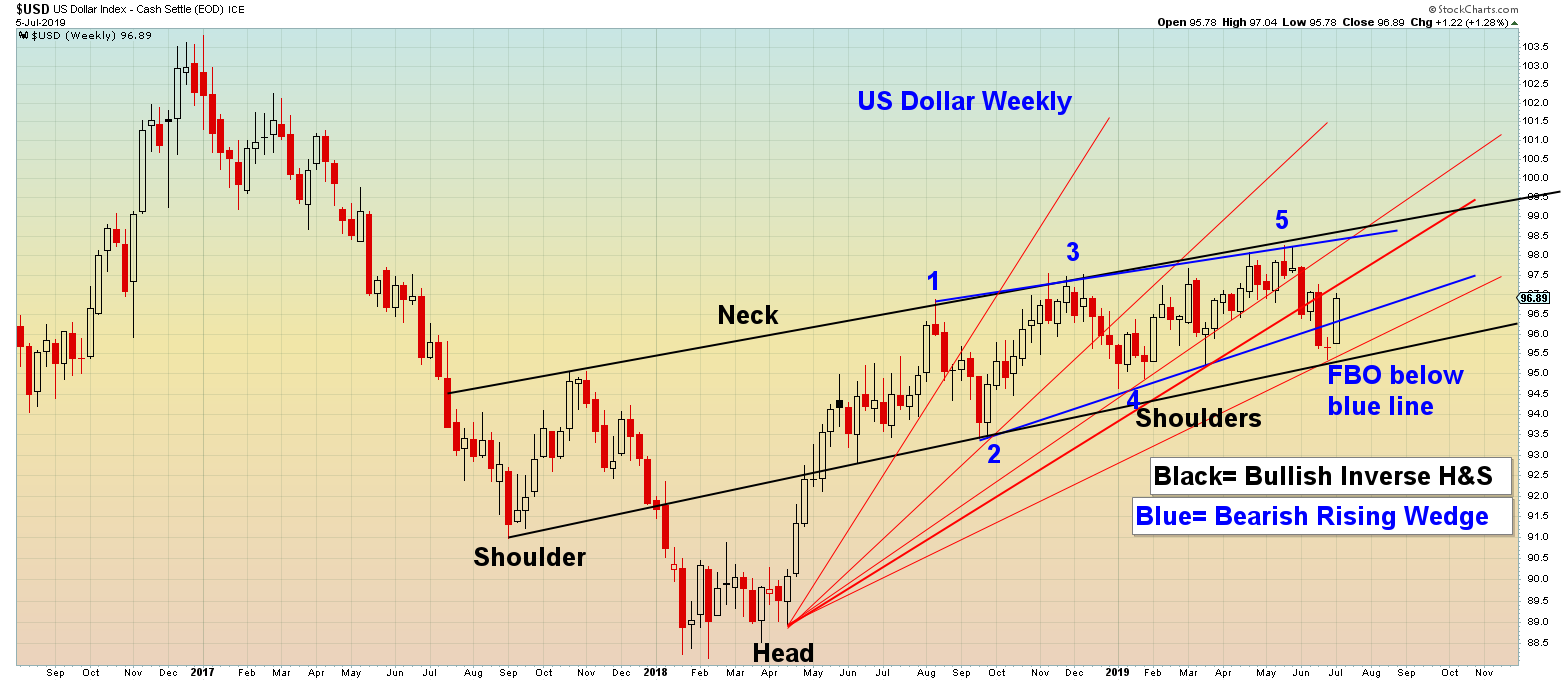
I see a bullish inverse H&S possibility shown in black.
I see a bearish rising wedge shown in blue.
The red lines are at best some kind of fan line or the dollar looking for a trend channel bottom support rail. You can’t use the red lines as a pattern line or which one do you choose? It has broken below many of them. Why is the last one that broke down more important than the others?
The thicker red line has been shown to be the bottom rail of a bearish wedge. I disagree with this assessment. I believe the blue line is the bottom line of the wedge and it broke down and has turned into a false breakdown at the moment.
Good Chart Chuck
The only thing for sure is that the Dollar has gone exactly Nowhere for a year.
But Gold has been rising in ALL currencies .
My thesis is the currencies are all weak and will remain in a somewhat narrow band verses eachother as they all fall vs real money…
Bitcoin
🙂
Could be.
Plus bitcoin, as you mention, as well as the hundred of other crypto currencies competing for dominance and funds could slow gold’s rise this time… until as I think we’ll one day see, and as even Ron Paul proposed, a global currency(global cryptocurrency maybe?) backed by gold….
Thanks PC. This makes your thinking much clearer to me. I understand what you are saying, and I take your point. As always, time will tell. I remain bullish gold and bearish Dollar until their respective long cycles turn again. If I’m correct, all chart patterns will eventually resolve upwards for gold and downwards for the Dollar until then.
Makes sense. Thank you NorthStar.
Right now Gold definitely leads bearish and the dollar slightly bullish.
What ever happens it will be major fun to watch.
Concur