GDXJ or GDX
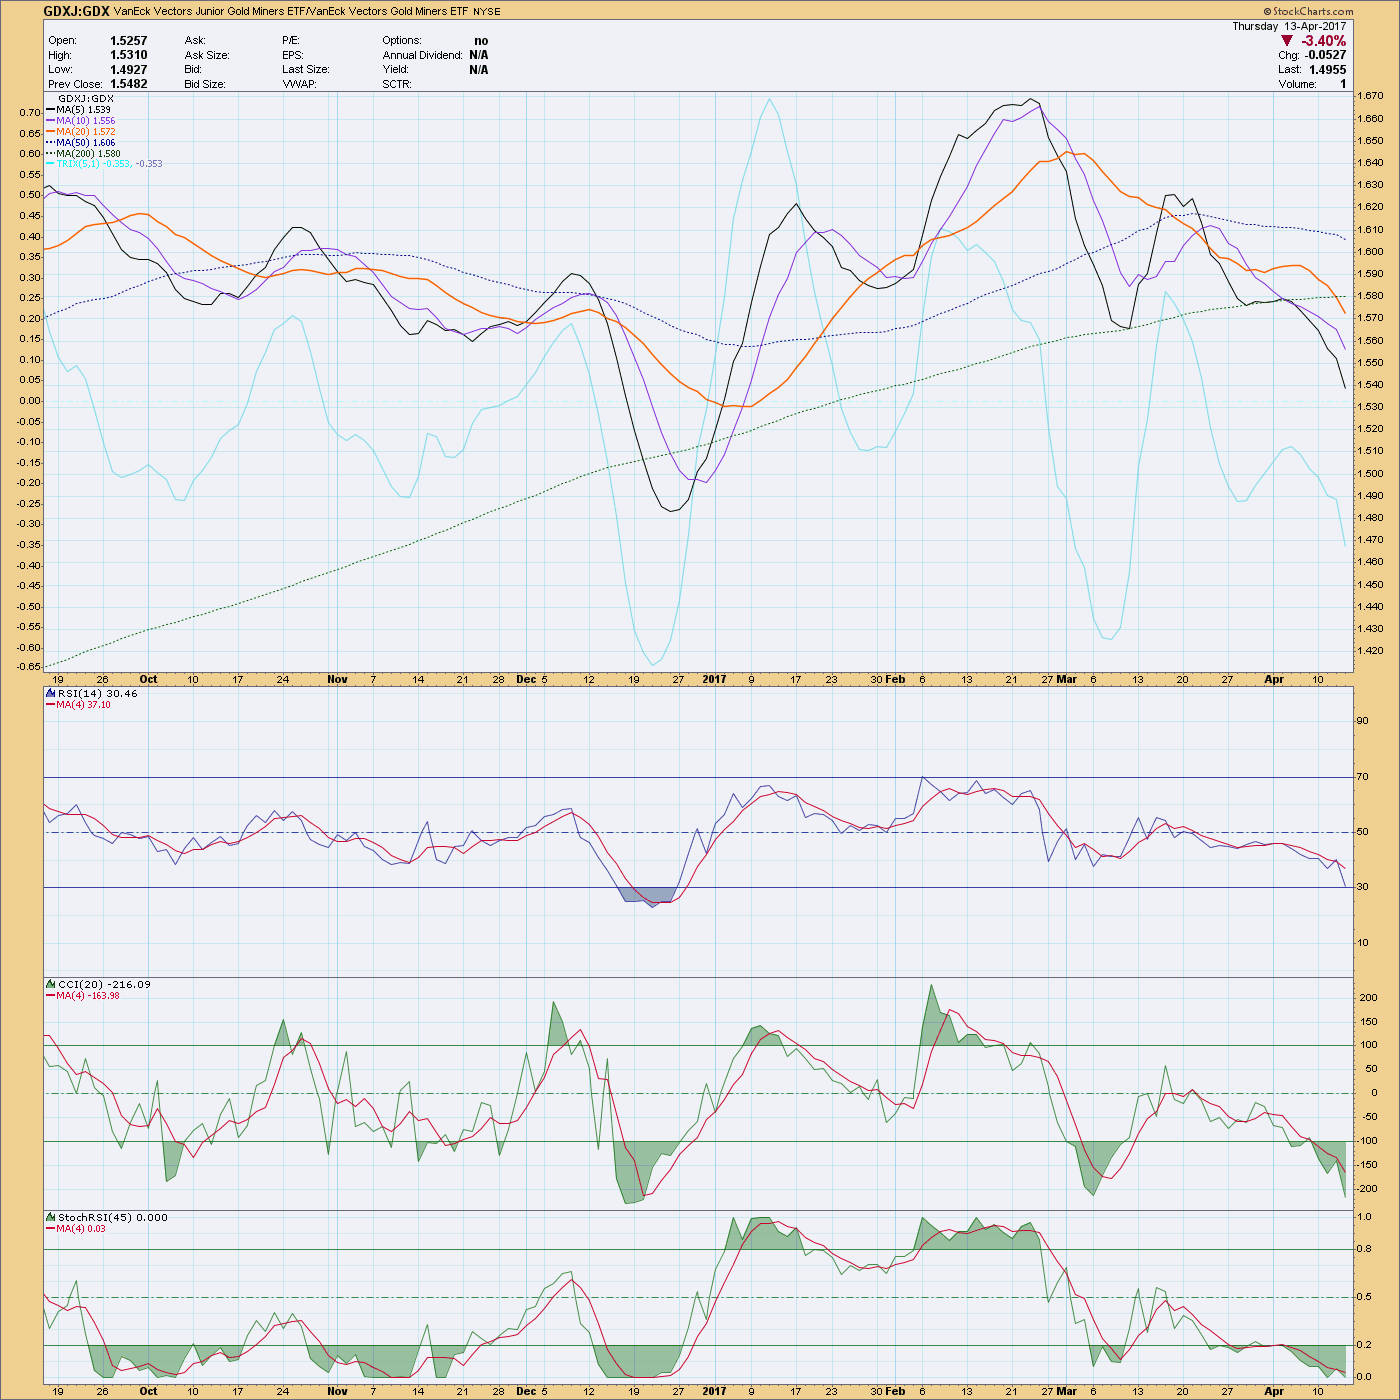
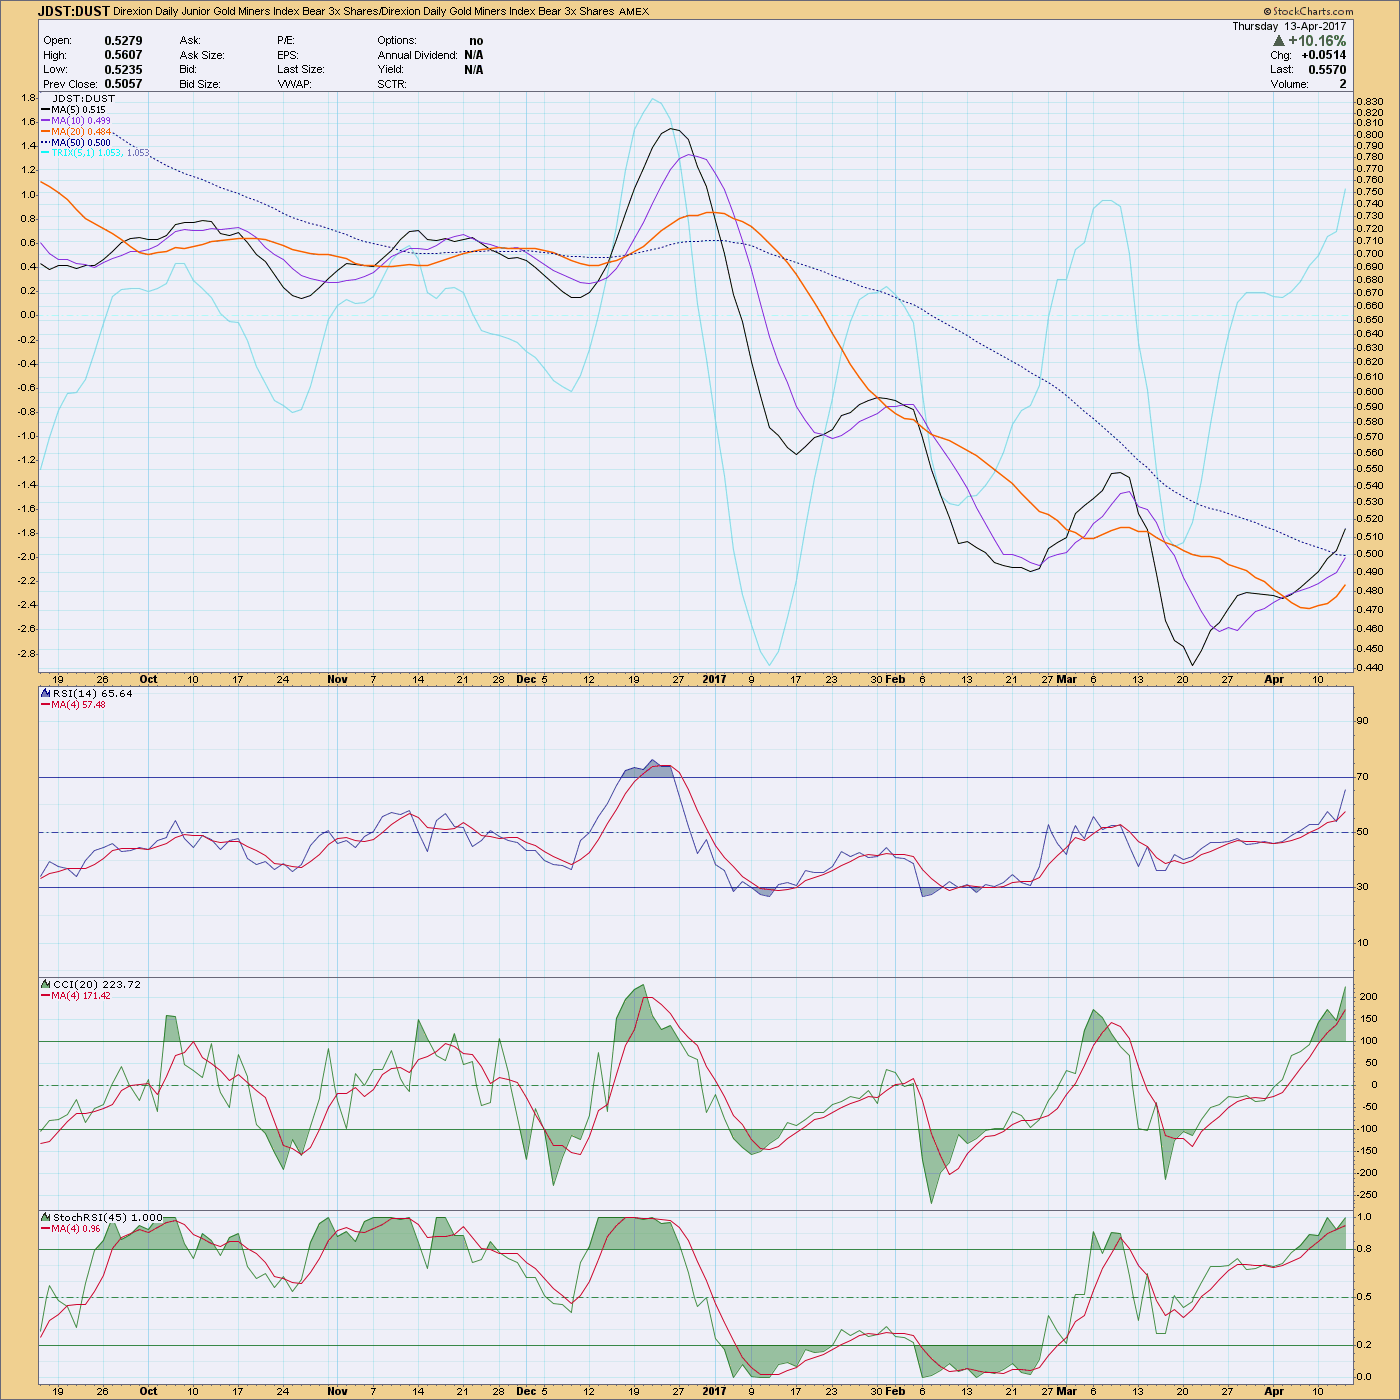
The other day I posted about the large difference in the translation of GDXJ and GDX as far as which one might be the soon to be leader. The translation meaning that strange difference in the prices of them over the last month. We found out yesterday that it was due to rebalancing. Anyway, here are a couple of charts that show the strength between GDXJ/GDX and JDST/DUST so if you are going to go bullish the miners you should be able to look at the GDXJ/GDX chart to see which looks to be the stronger of the two and vice versa JDST/DUST. Admittedly, maybe a little confusing at first but if you only look at the RSI it will be simpler. Keep in mind that the RSI corresponds to GDXJ in the GDXJ/GDX chart and to JDST in the JDST/DUST chart. So, in spite of the timing of the daily low being very near, it looks like there be a little more upward movement in GDX. When it starts moving down, DUST should lead over JDST because JDST is nearing the top of it’s lead over DUST. What GDXJ will do over the next few days is unknown due to the effect of the rebalancing. If playing 3X, substitute JNUG/NUGT for GDXJ/GDX.
I do not follow GDX or GJDX or their derivatives or understand them much. The news cited in the following may have already been adequately discussed on this site yesterday and may for all I know be unimportant, but just in case it’s of interest–
http://www.zerohedge.com/news/2017-04-15/junior-gold-miner-etf-suspends-creation-orders-due-shortage-underlying-instruments
A couple of apparent so to speak Nuggets from the piece (which I frankly do not fully understand):
>>>
While details are scarce… the 3x levered cousin of the GDXJ, announced on Thursday after the close, that “effective immediately, daily creation orders in the Direxion Daily Junior Gold Miners Index Bull 3X Shares leveraged exchange traded fund (Ticker: JNUG) are temporarily suspended until further notice. Redemption orders for the Fund will not be affected, and will continue to be accepted in the ordinary course of business.”
The stated reason: suspension is due to the limited availability of certain investments or financial instruments used to provide requisite exposure to the MVIS Global Junior Gold Miners Index.
….
Direxion notes, “….This suspension does not impact the ability of investors to trade shares of the fund on stock exchanges.”….
One idea voiced by “Tech Strategist” Fred Hickey is that the GDXJ ETF has seen so much demand since the recent gold bull market began 15 months, ago that it has had trouble buying enough Juniors that meet its criteria. Furthermore, GDXJ ownership positions ran up so high in several core names (approaching a 20% threshold) that it could effectively buy no more, going back to the original issue of ETF creation being limited by endogenous liquidity and stock technicals.
Hickey further notes that differences around the GDX/GDXJ ratio in the last week were probably due to a rebalancing, but he claims there is “no getting around GDXJ has had shortages of junior miners.”
For now it is unclear if the JNUG suspended due to an investor stampede into the ETF in the last few days of the week as gold broke out, or there is simply a liquidity constraint. Both may be relevant.
<<<<
Thanks Karl, I don’t totally understand it either but it doesn’t sound good. Last I had read on Friday, GDXJ had brought on board a few more companies to fix the issue. I do trade JNUG and JDST so I hope this doesn’t mean that they are to unstable to be in. There was a post a few weeks ago, I think maybe by Rambus, about these not being the safest thing to be in.
Heh, unstable to be in ….. read about what happened to TVIX a few years back. You can be 100% on the right side of a trade but ETN’s can ‘adjust’ with absolutely no notice. Beware.