Real Stuff Looking Real Good
Notice a THEME here ?
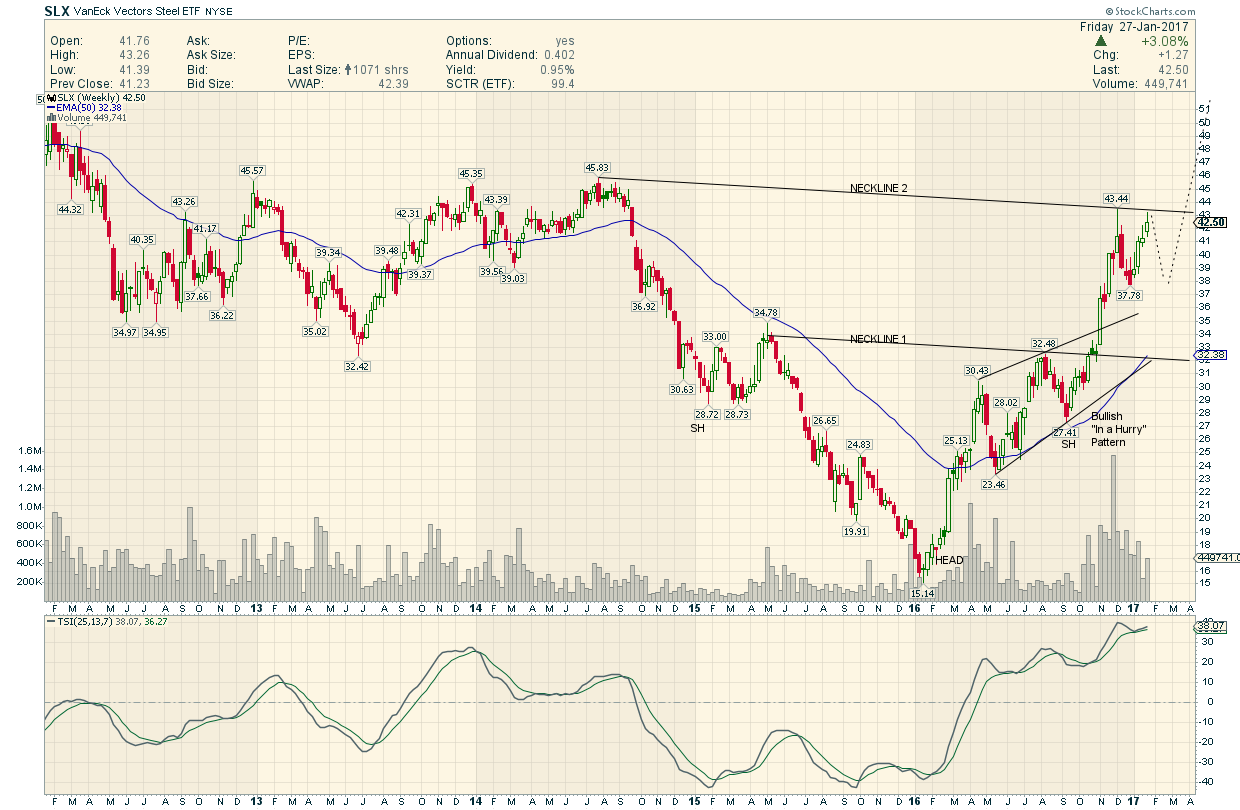
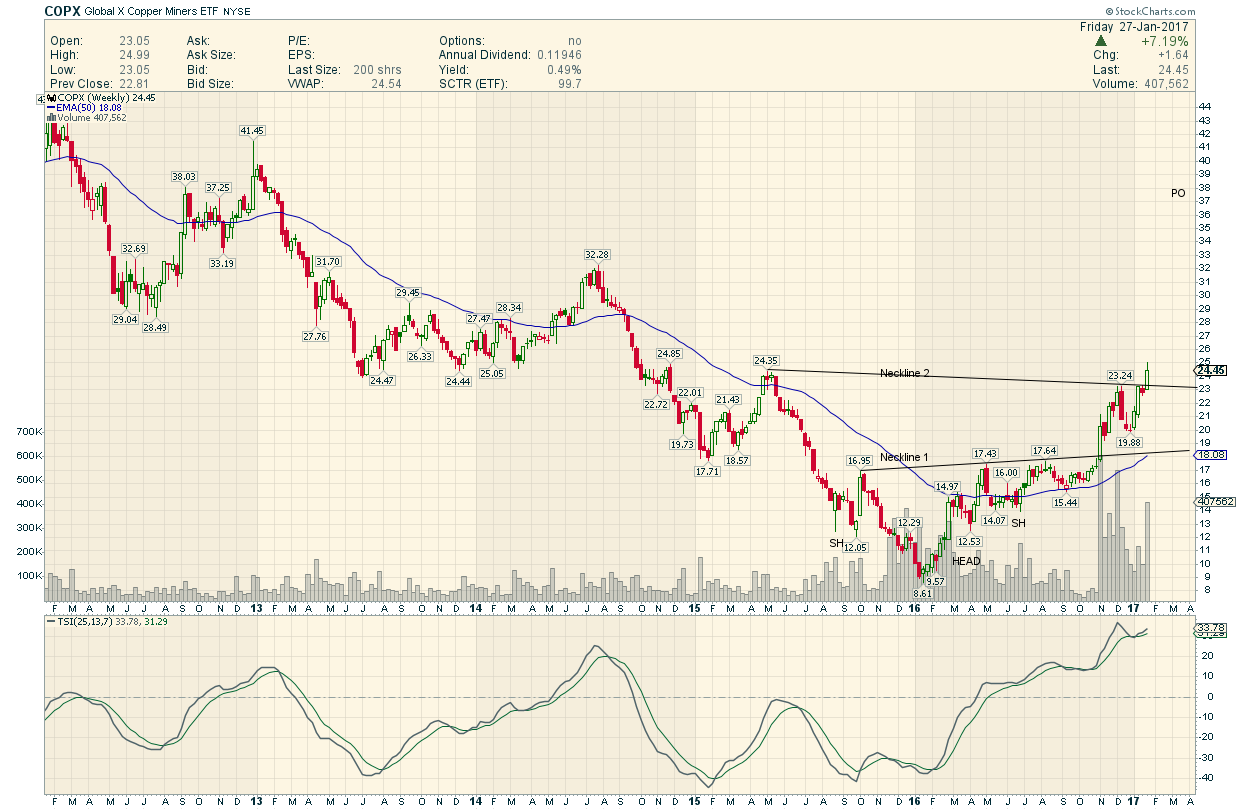
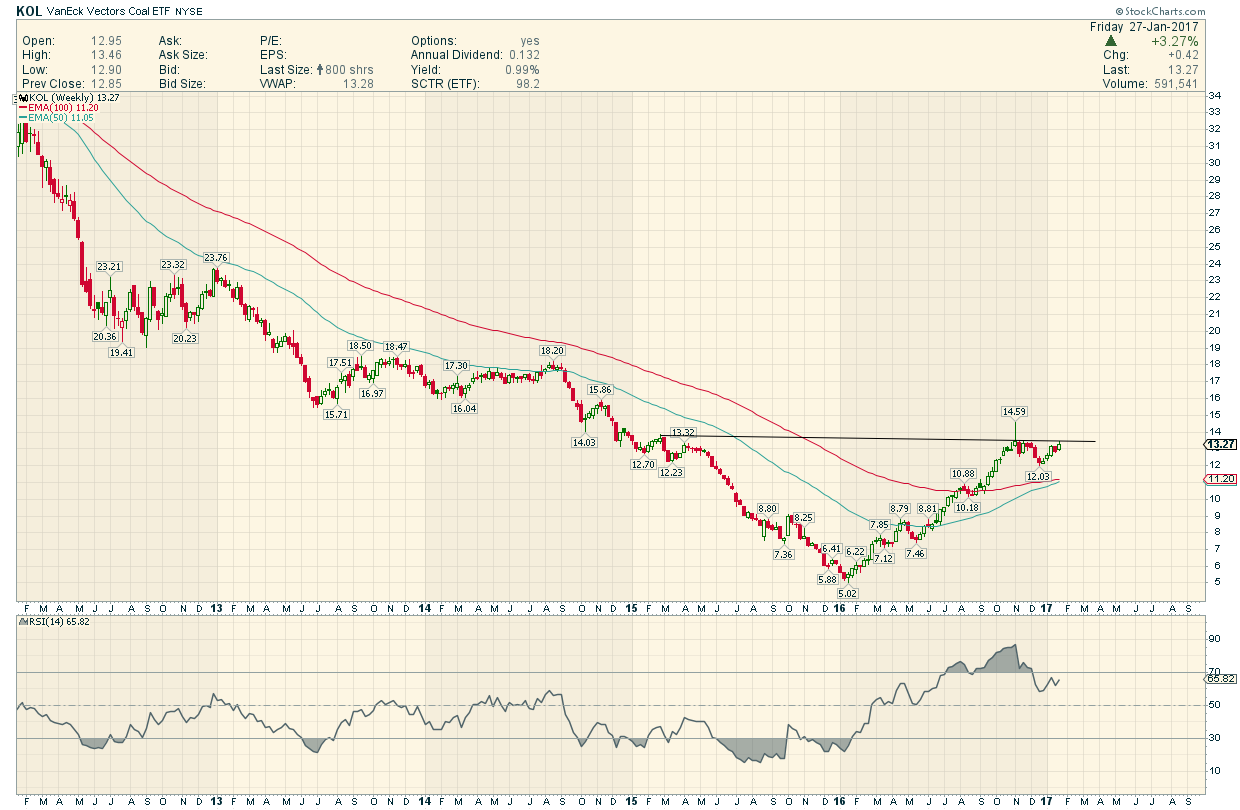
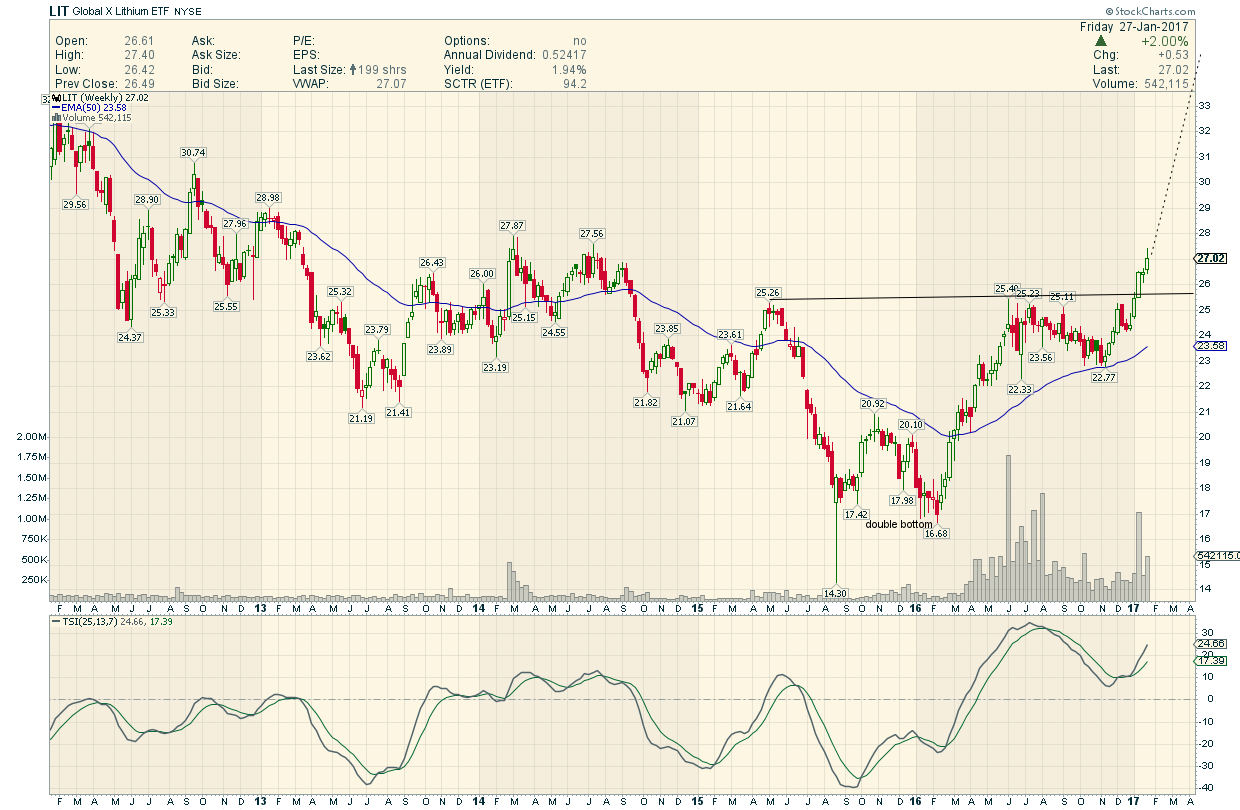
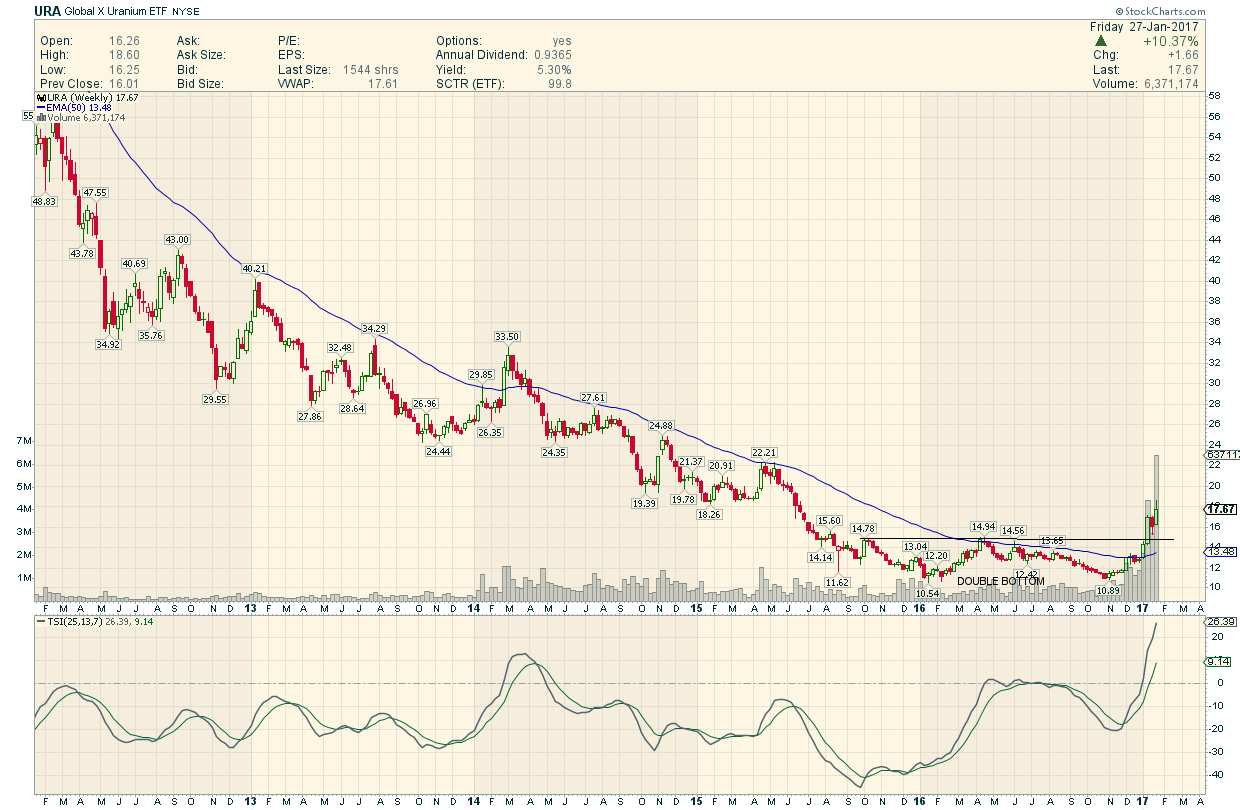
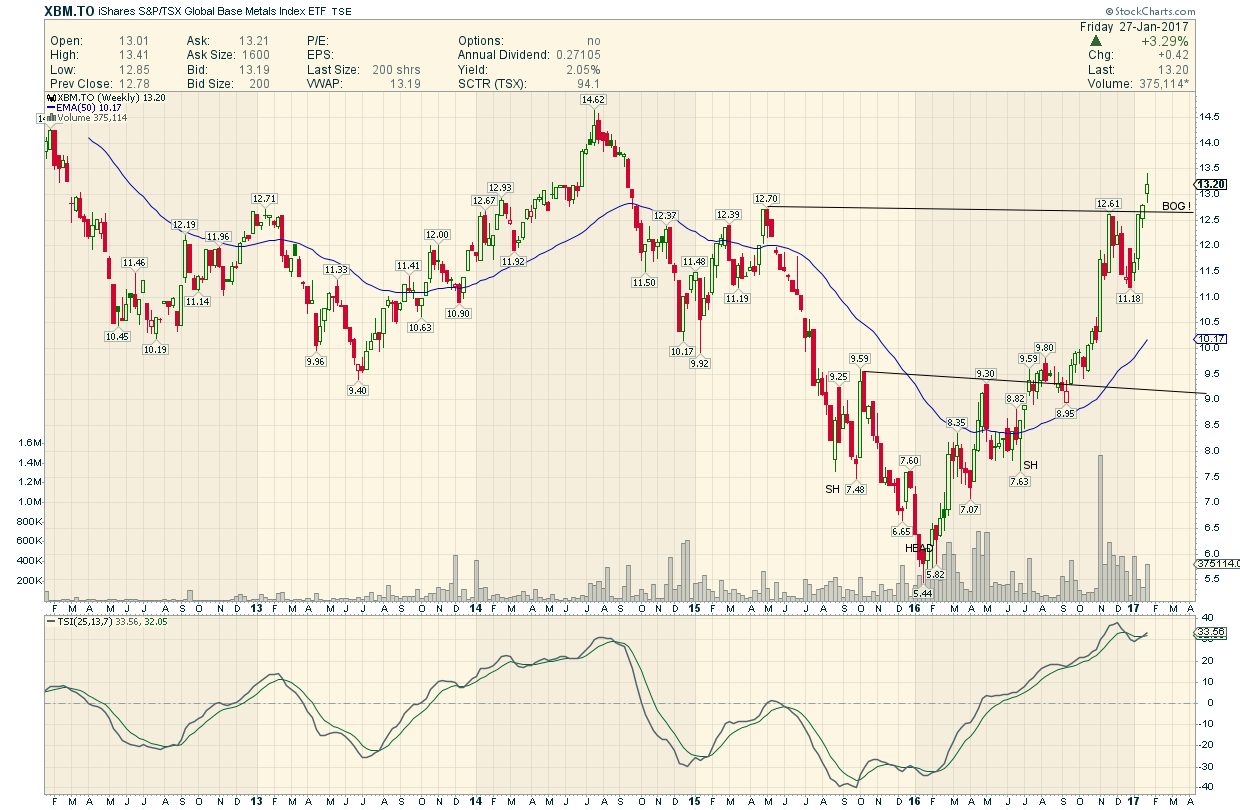
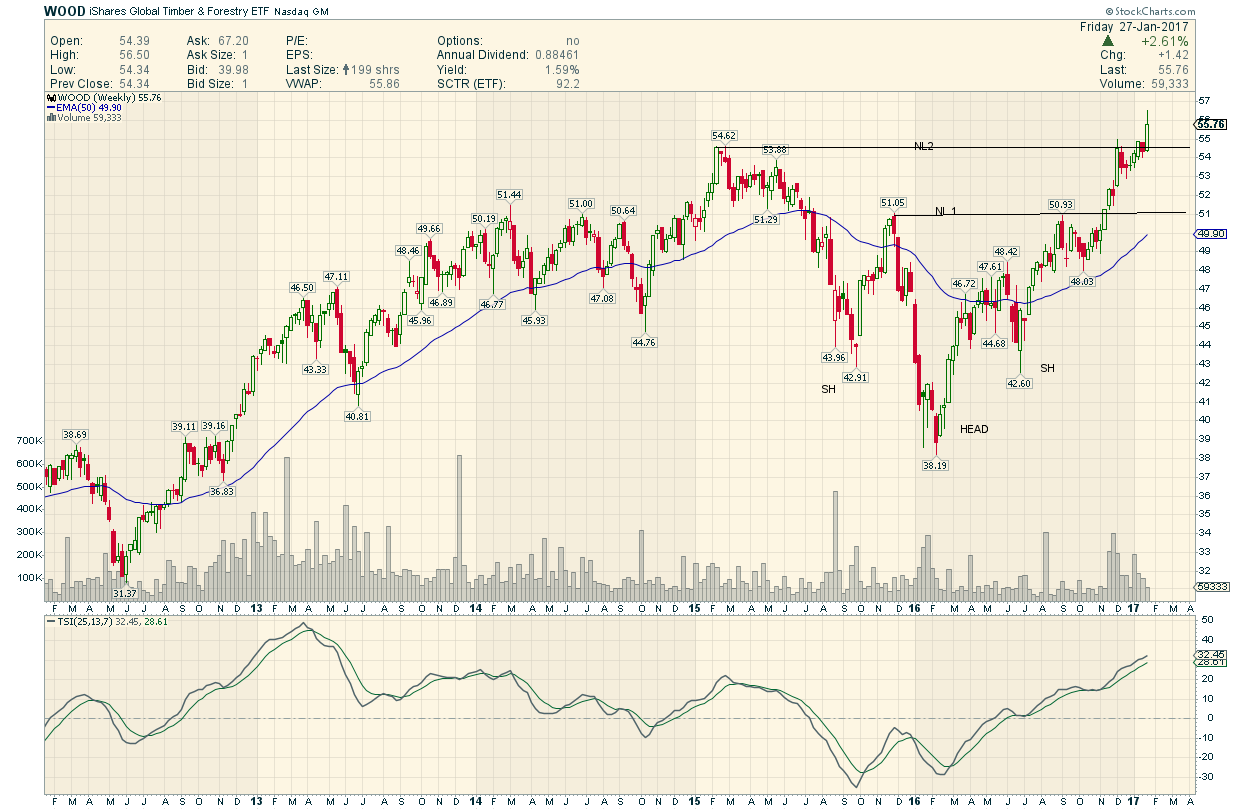
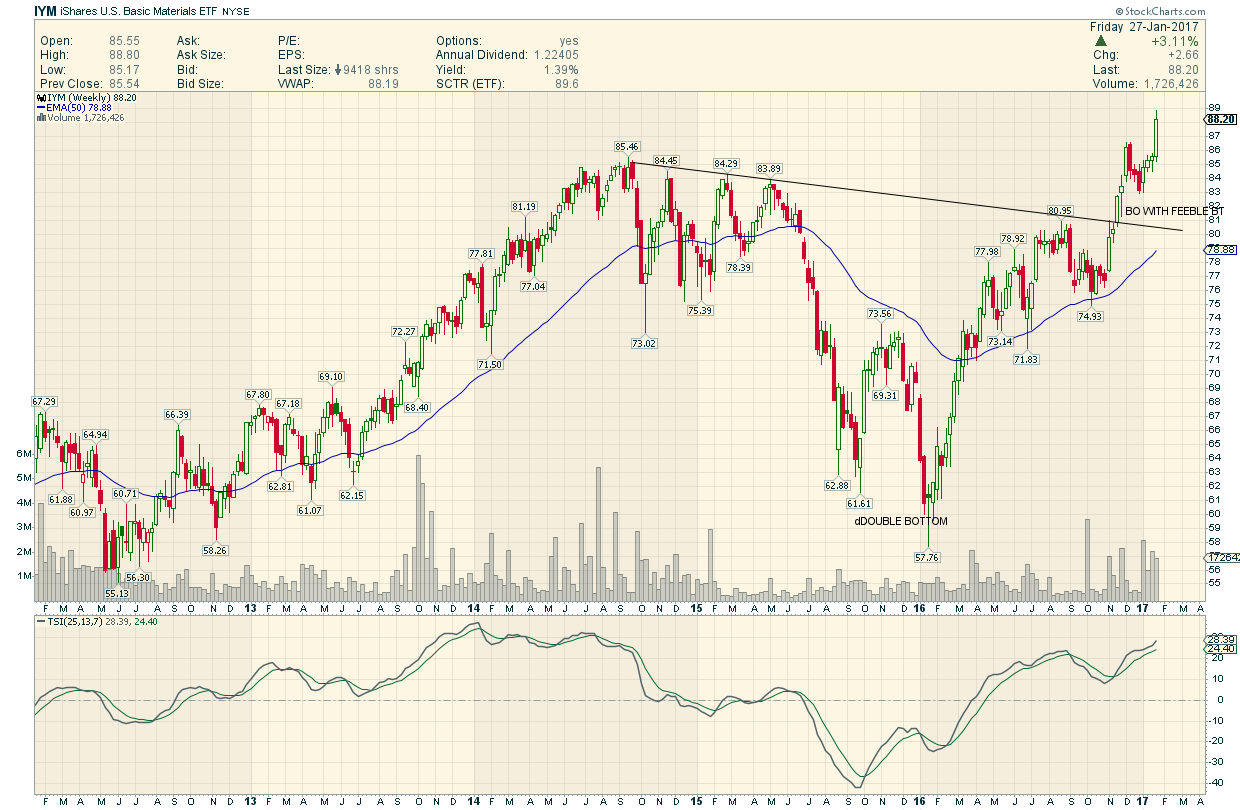
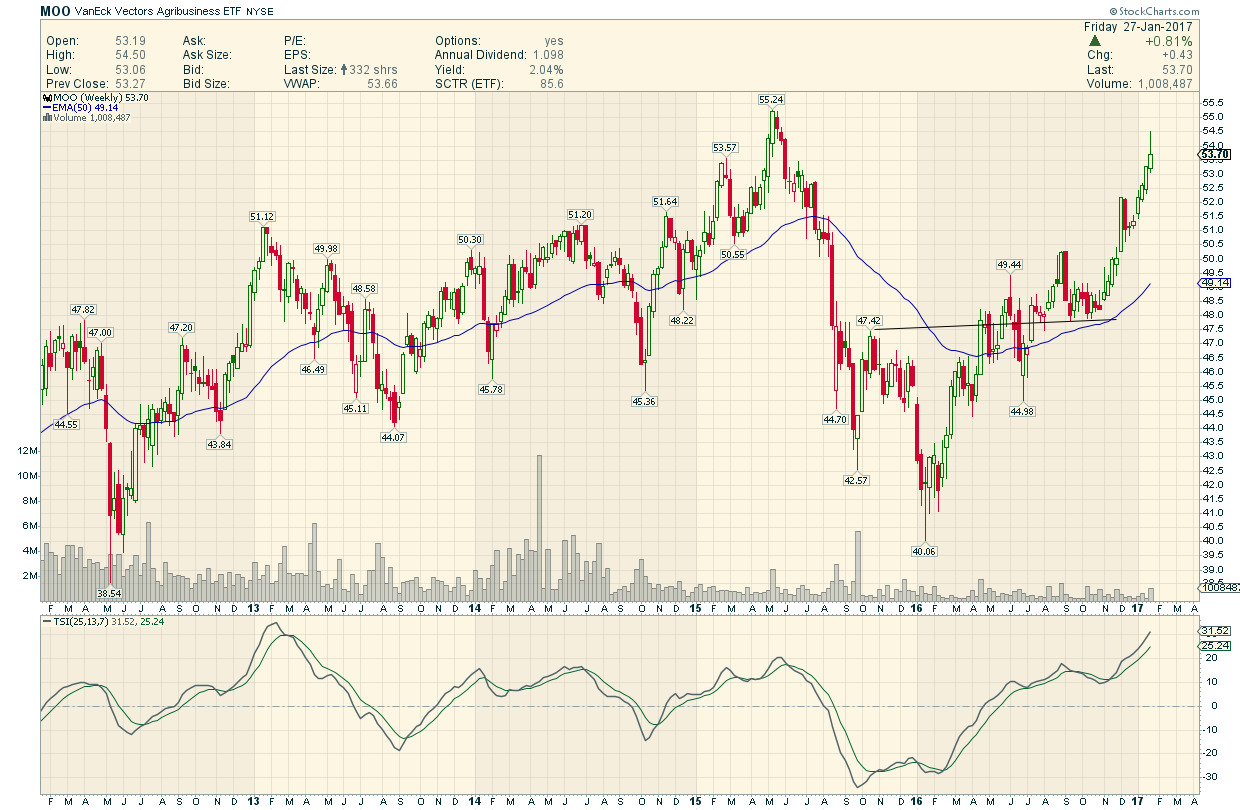
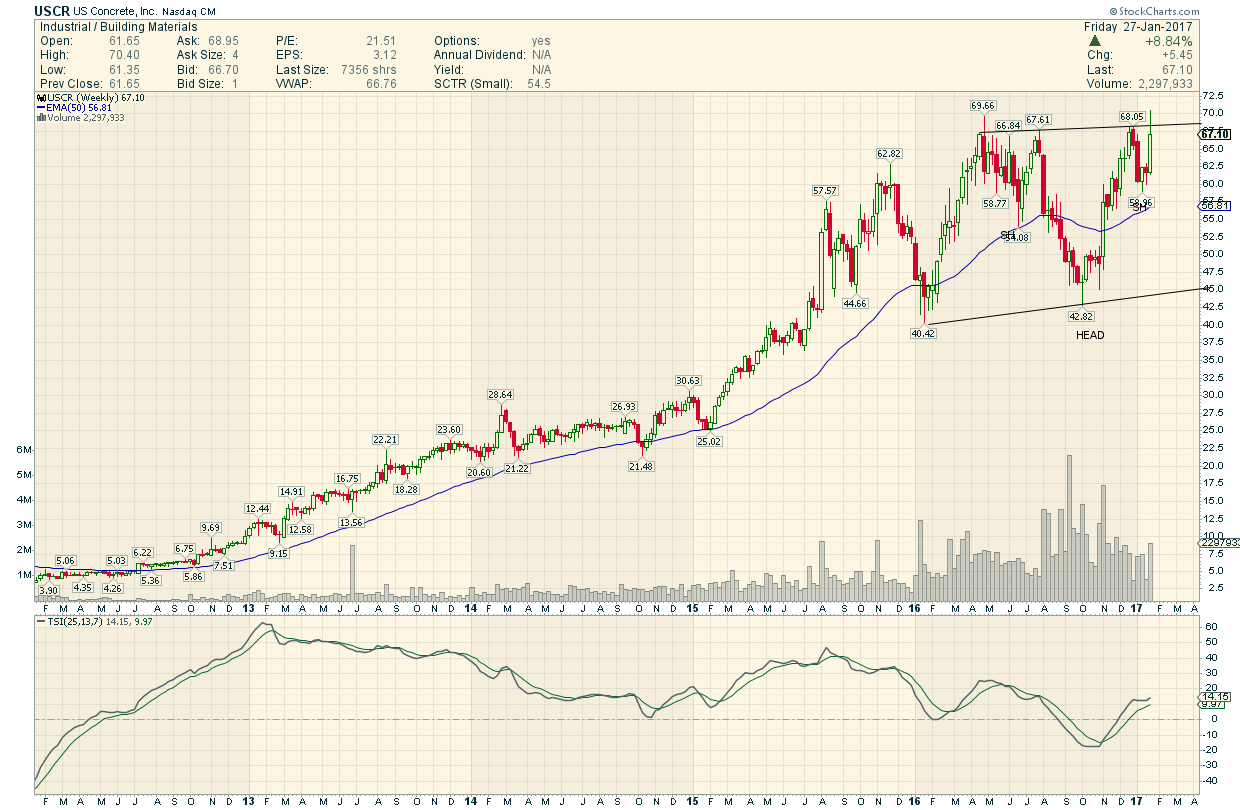
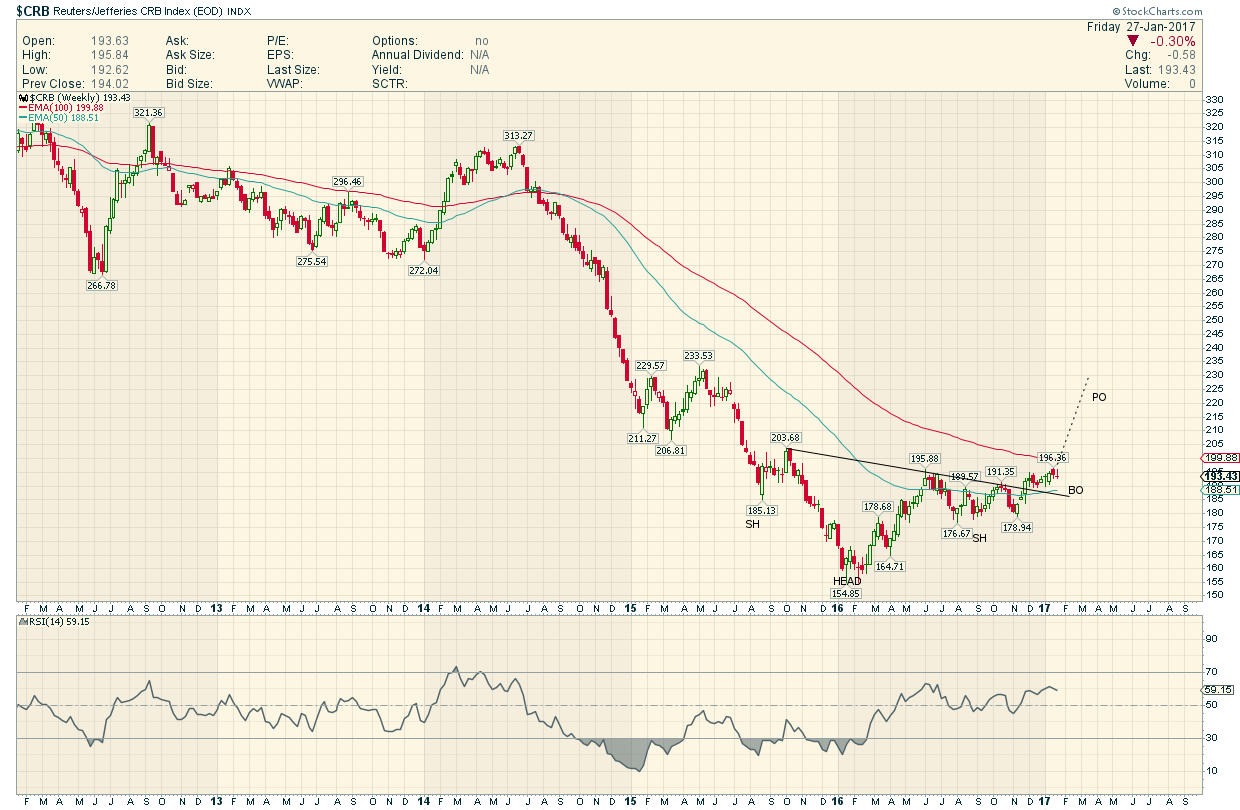
EVERYTHING Real Started a V Bottom move in January 2016 ( When Trump was just a Joke)) , and has generally moved UP without a Correction .
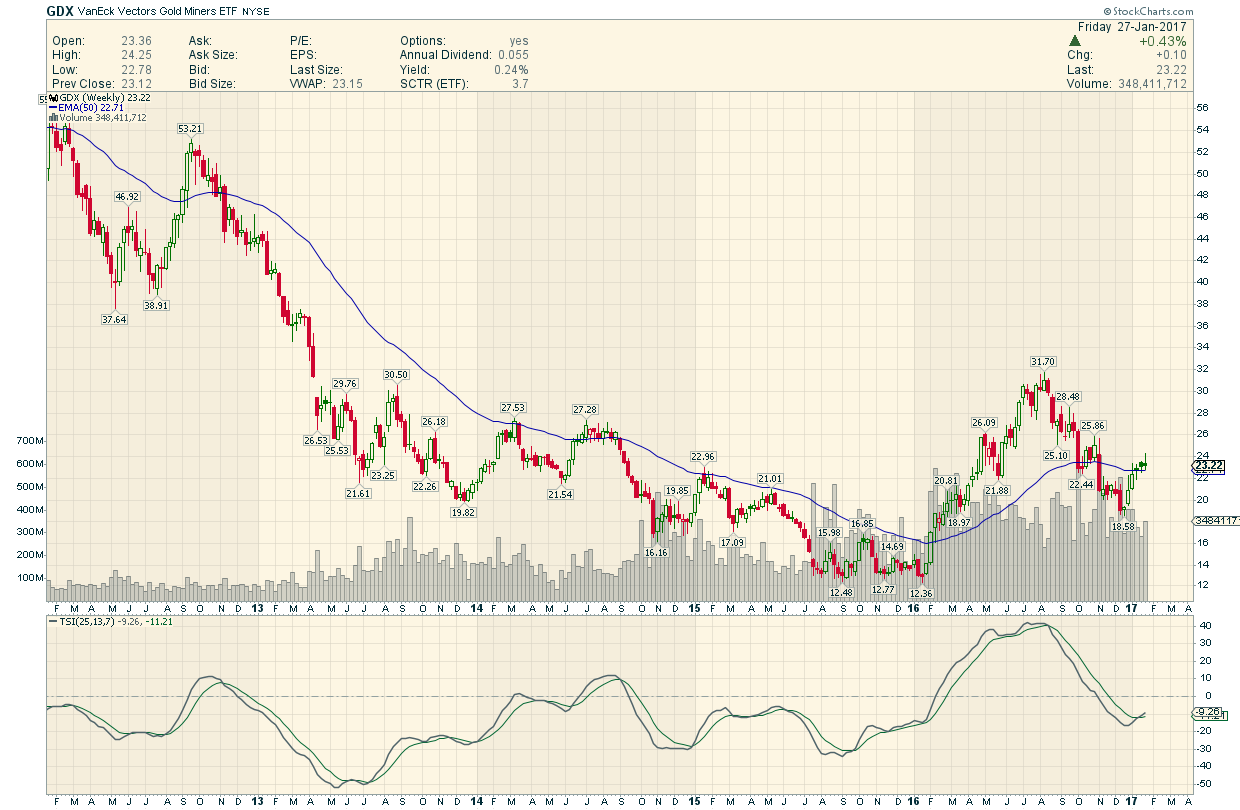
for a year now ( Can you spot THE Notable Exception ?)
This is really something ! These Charts are showing Gorgeous Breakouts and near breakouts. How do we explain this Epic Move afoot in real stuff which all started with an epic bottom and all at the SAME Moment !?
Jus scroll down and look at the bottoms ..all exactly the same time !!
And how do we explain the present disconnect in said notable exception ?

All these charts Inspired by Rambus Work. (Nobody that I have seen else has spotted this)…and I ask How Come ?
Steel Stocks
Copper Stocks
Coal Stocks
Lithium Stocks(Batteries)
Uranium Stocks
Base Metals Stocks
Pulp and Paper Stocks
BASIC MATERIALS
AGRICULTURE STOCKS
Energy Stocks

Concrete
Commodity Index
Gold Stocks
It wasn’t just real stuff. Paper of all kinds rallied from Feb 2016.
As usual, some stuff began to rally on the rumors, in January.
The rest followed.
“The ECB is ready to do its part,” Draghi said.
As someone put it on another board, Draghi and Abe/Kuroda have been counterfeiting like mad …
— that was a deliberate choice of words —
Draghi bought corporate bonds — freeing up cash for share repurchases.
And the Jap CB bought ETFs outright.
Others are recycling the proceeds into US stocks as dollar based currency hedges.
As for your outlier ….. same old same old ….
Paper > Rock …. they pull out the scissors.
Good Point Pedro BUT Commodities and Materials don’t usually move WITH Paper ..they are counter cyclical no ?
And the % moves in these indices Dwarfs the Paper moves.
Allow me to be stupid enough to get involved.
**On the one hand** ->
Without looking for analysis of basic commodities, I began seeing bloggers or analysts (not many, but I could cite 2 or more) suggesting base metals and certain base metal stocks were turning and should be bought in the 1st half of 2016. I am fairly sure I have seen informal comments to that effect here and elsewhere by various people for months. Charts have been included at times.
**On the other hand** ->
I have seen remarkably little emphasis or publicity about the matter in my casual scanning of financial sites. If I hadn’t been looking (as I was buying) I might well have noticed zero.
Thus -> Both points are correct. Yes, people have forthrightly made the call, but no, not in a way that gained the slightest traction in the way of publicity as far as I can tell from my casual scanning. Maybe one can reasonably take credit for making specific calls. Maybe a discussion of how a market turn becomes publicized would be even more interesting. But there aren’t so many grounds to spend time for dispute I believe.
Washer has been strongly bullish on part of the agricultural sector for some time now.
Agree Karl…There was Little to no emphasis on this phenomena and my point is ALL these things were tanking hard into Jan 2016 when they all turned together and most are still in breakout mode ( Except Gold Stocks)
I only paid attention to these and had them on my radar because Rambus was highlighting their move all the way.
maybe we all got gold fever and don’t realize it and have our heads too far in the gold pan too see the rest of the world. Definitely something afoot here, did not realize that it was that far out of whack. Maybe the big boys know it is being called dirty money by the leaders and chase into other off the radar stuff. Diversify as they say. Perhaps a stock of each in the matrix portfolio instead of the 1% moonshot pics.?
Exactly..we all were focused on PMs..while Cement and Wood were busting a move…LOL…Couldn’t see the Wood for the trees.
after a closer look I will say that gold is the only one that is backtesting the 50 right now, all else looks too far away in the clouds and must come home for a visit one day. Do we go further down with that ship is my question now.