Plunger has Flipped
This is from Plunger’s Post Tonite at the Chartology Forum
et tu Plunger

…………………………………..
Knights since we are allowed to hang it out there and think in public, I am making an exploratory buy call for the gold stocks right here. Sounds crazy, I know and I am doing a complete reversal. No I have not undergone a bull market conversion as we are still in a bear market with lower lows to go, but we might have another rally here in front of us. I agree with Rambus’ Wednesday night report showing the long term bearishness of this sector, but I think the technicals allow for another rally here. For how long? I don’t know. So lets take a look.
First off when the next bull market comes it will be fueled by the real price of gold rising against everything else. The stocks will eventually fly because of lower input costs for the mines. This dynamic has actually been in effect for over a year now and its starting to flow to the bottom line of some companies. That’s what we saw today with Gold Fields….profit plain and simple:
So this dynamic can be seen in the following two charts:
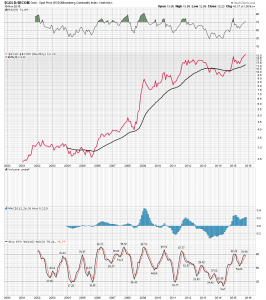
The big savings in oil can be readily seen since last summer and overall commodities declining has made the 30 W EMA resume its rise as can be seen in the chart. Ok we all know this, so here is my analysis: These stocks are turning here on this dynamic. They want to start their next bull market, since they don’t even need the nominal price of gold to rise as long as everything else falls. But the downward momentum is so great that it acts as a giant undertow to this sector. So my point is if gold stops going down for any amount of time the profitable stocks are going to act like a beachball held under water and we will get spikes up until gold resumes its decline. We may be in for such a spike right here. It could last from 2 weeks to 2 months IMHO.
So here is what I see with my gold bottoming system I have developed. The long term trend indicators are all down, no doubt, but the short term trend indicators may allow a pop here. First off is my GDX:GOLD ratio:
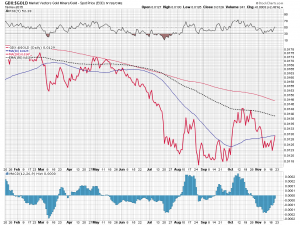
Note we have a nice bottom forming. we just retested the August September lows and the last 2 days showed a higher high. This is bullish. Note the histograms ready to go positive. We like stocks to out perform the metal remember.
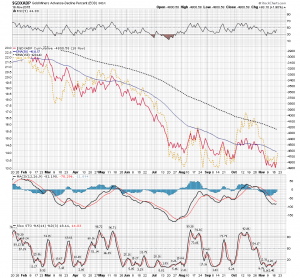
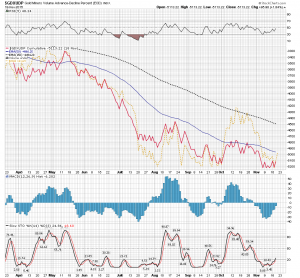
Next I have the Gold Miners ADV/DCL charts. One percent volume the other simple issues. Not really bullish yet, but in a position to start a rise as they have spent the past 2 weeks bottoming and you can see the HUI responding to that.
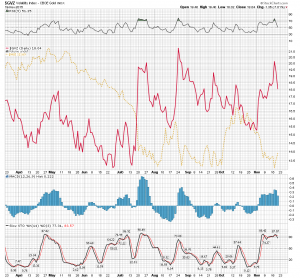
Next we have gold volatility. Its positioned to come down which would accommodate a rise in the stocks.
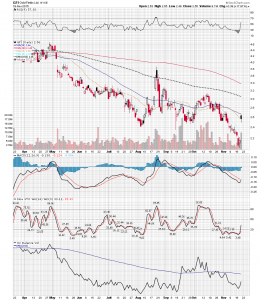
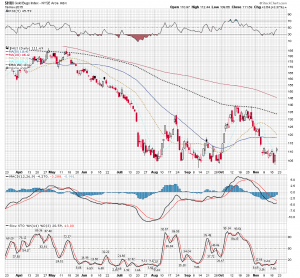
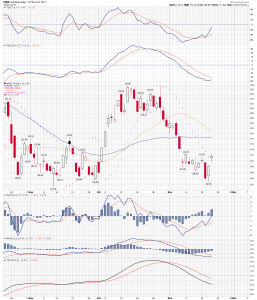
Take a look at the HUI and consider the question is this bottoming action or a prelude to a breakdown. I guess that’s the question and I see possible “green shoots” here. Everyone is waiting for the meltdown to come in early December. What if this is the bottom? First chart look at the RSI divergence from the previous low and on the second 4-horsman the PSAR gave a buy signal today and all of the horses are getting into position.
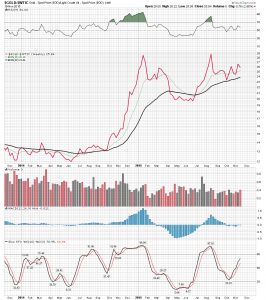
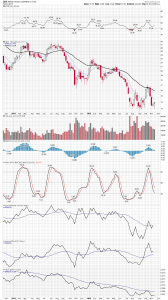
Now look at the weekly GDX where we can observe OBV. Both OBV and ACCUM/DIST are looking positive!!!! Also look at this weeks candle with the nice looking engulfing hammer for a bottom. Again bullish. The RSI positive divergence can be seen more definitively here. Yes, I see the big black 30 W EMA and that’s bearish and it won’t be a bull until this turns upward and is retested from above. But we can rally up to it at least
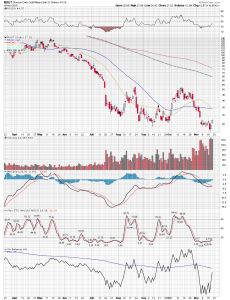
And now take a look at NUGT. I honestly don’t know how to analyze the volume because I tend to think NUGT holders are from the sucker class, but look at the huge volume here. Somebody is getting into this stock in a big way.
So there you have it Knights….Are we at the cusp of a rally?
Plunger
A sharp rally would screw the most people, so yes. I can agree with you on that. The duration of it is up for debate.
I’m decidedly NOT in this camp.
My monthlies are looking out towards next spring before the next window for a bottom could form.
I won’t rule out a bit more upside here, but my monthly trend indicator is declining and my weekly hasn’t even flipped to a buy. So I have this as a countertrend bounce.
None of this is based on EW, but that work still has us early in the final descent.