POPULATION GROWTH OF STATES SINCE THE LAST CENSUS IN 2020
We have a debate regarding a Post from Columbia which said that the Illegals in the US ( 50 Million Strong is the allegation) are disproportionately in Blue States and if they are allowed to remain in the country by the next census in 2030 they will cause an increase in Electoral college Votes going forward such that starting in 2032 the Map will favor Democrats in perpetuity.
I was surprised to learn that even if Illegals do not vote they ARE included in the census….so it was a plausable scenario requiring a closer look .
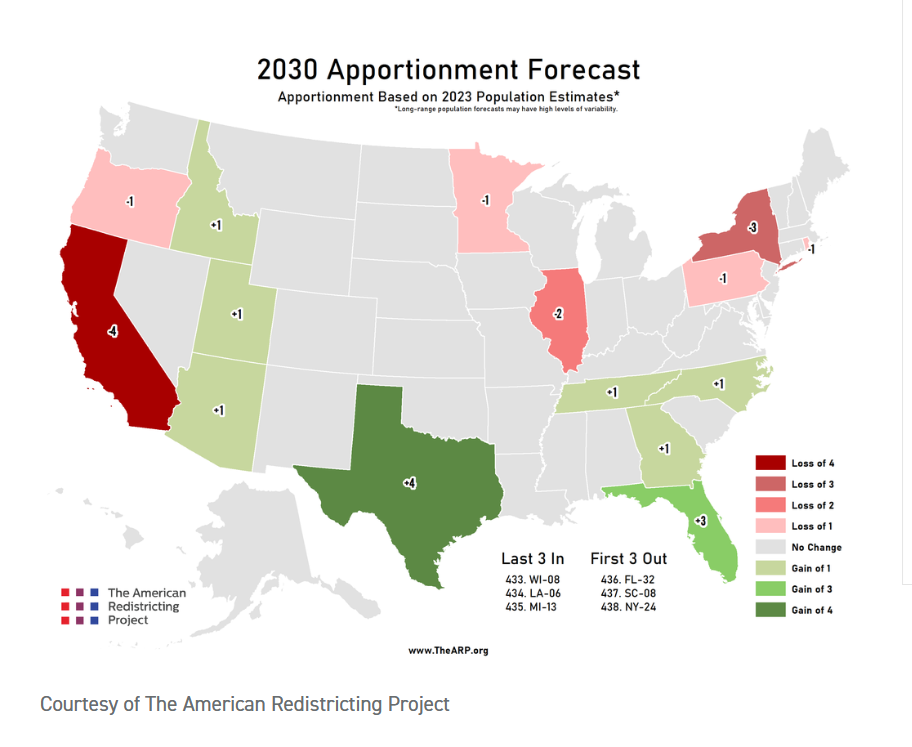
I argued that I have seen the projected Electrol Collage Maps Projected from current population trends
showing exactly the opposite. by 2030 Red States Gain 12 EC Votes and Blue states Lose 12 …which doomes the Dems .
I also argued that there are NOT 50 Million Illegals in the country and that they are NOT disproportionately living in Blue States
I got pushback for citing Pew Research and Politico as questionable sources so for course being a Tenacious Argumentive SOB I searched for the ONE source of information that settles the debate
……..
First Here is a Article Projecting the Electoral College Changes after the 2030 Census
https://www.politico.com/news/2023/12/20/census-population-estimates-reapportionment-00132620
no need to read it all but here is the Bottom Line.
……………..
Here is the Pew Research Survey of Undocumented Residents and their distribution as of 2022
…………………
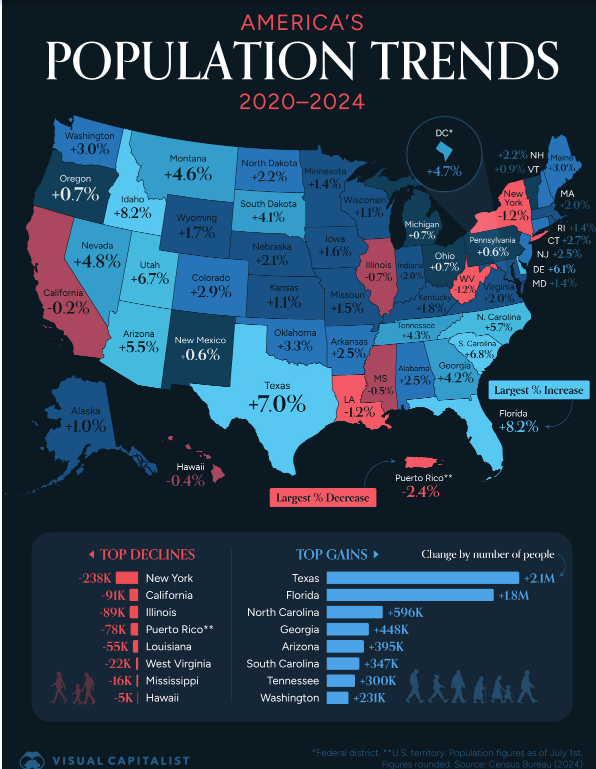
Here is the Research from Visual Capital Named
Mapped: How Each U.S. State’s Population Has Changed Since 2020
https://www.visualcapitalist.com/mapped-how-each-u-s-states-population-has-changed-since-2020/
Here is the Bottom line Map from this Source
The Internet is an amzing source . This research took about half an hour . We need to be vigilant of Articles from “Our side” which use fear mongering for click bait IMHO
Theas only point I was trying to make really (besides questioning your sources) is that no one has any idea how many tens of millions of illegals are in the U.S. much less where they are. If they are “included” in the census that means they are getting a census questionnaire (or are being contacted by a census worker) and responding. I’ll grant you that there are many living in homes and apartments that would indeed respond – but what about those millions here who under no circumstances would be captured in the census umbrella?
More encouraging info is the current court decision that undocumented voters must be removed from ballots. That is the big game changer.
Regarding FL, the current renegade state government is really engaging in some very stupid RINO stuff, contrary to DeSantis’s leading. Just goes to show you how deeply RINOs are embedded in the GOP at all levels. And they do serious damage. Just like the inaction in the DC congress. Doing nothing is more damaging than anything at this point. How do you fight “doing nothing?”
Are they just measuring the movement of Taxpaying Citizens? I do believe more legal people are moving into Red states so it could counteract the spreading of the migrants around the country to Blue states. We will never know how many are in the US illegally but the USAID and other funded NGOs had a well organized pipeline to get as many people into the country as possible. Thinking that the Biden regime knew that even if these people can not be registered to vote, the Census will take care of the increased numbers.
Until recently, there were concerns that Texas was turning purple due to the influx of Lefties from CA, etc.
I don’t know where that stands now. Growth has been Austin (Leftie) centric.
FL has shifted from purple to red.
VA has shifted from blue to purple.
NC remains unpredictable.
NM used to be reliably red, decades ago.
Same with AZ and NV.
Now NM is reliably blue, and the others are purple.
So the States can grow or contract, but they can also change color.