First Majestic vs silver….
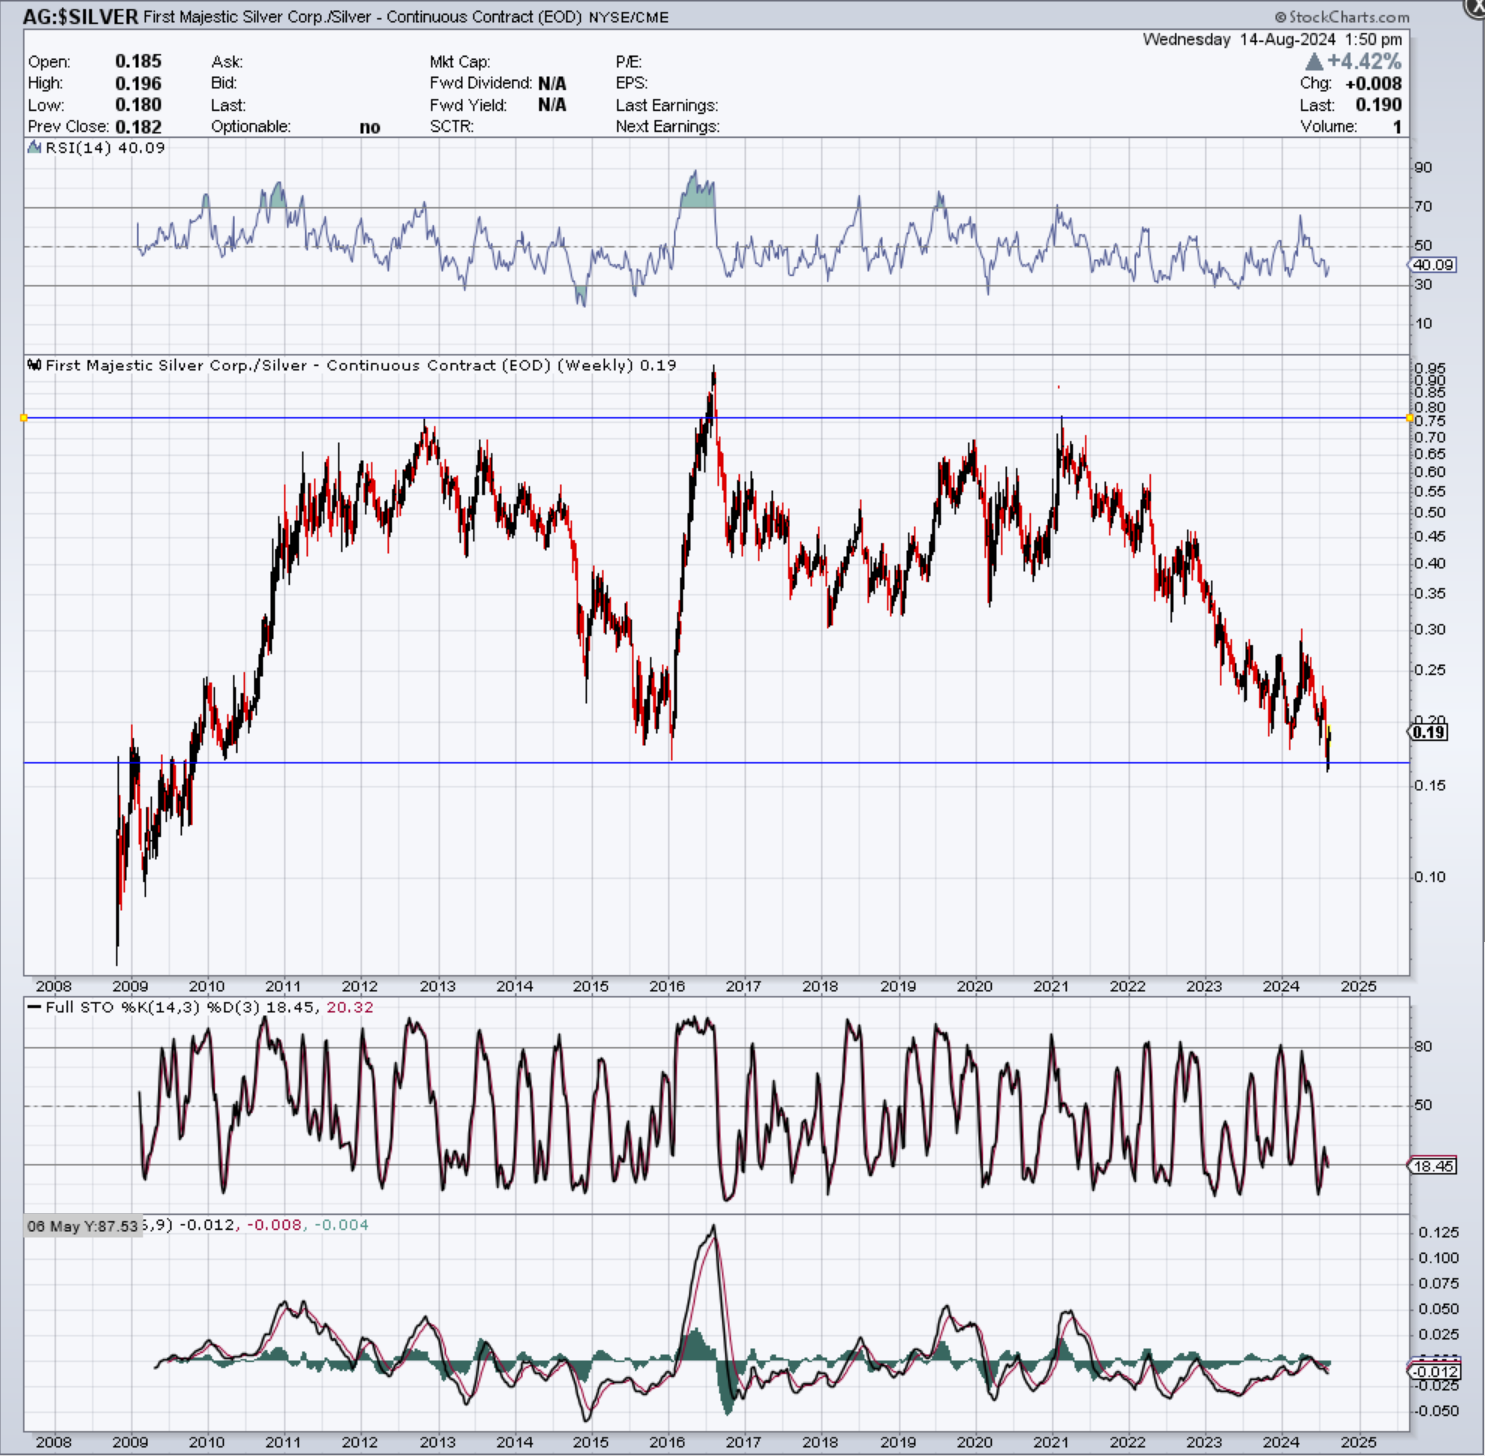
The ratio of First Majestic to silver has reached the very significant lows seen in 2010 and 2016 (see weekly ratio chart below).
Are we headed back up to the top of the range?
As a silver bull, I believe it will head back up. However, I am not so sure we get the moonshots we got out of the 2010 low (when silver went to $50) and the 2016 low.
FWIW, the uplegs and down legs appear to follow 3 year periods roughly (up 2009-2012, down 2013-2016, up 2018-2021, down 2021-2024, up 2024-2027?). The only period that is a little messy is 2016 to 2019, since the ratio appear to have made a double bottom over a year between 2018 and 2019.
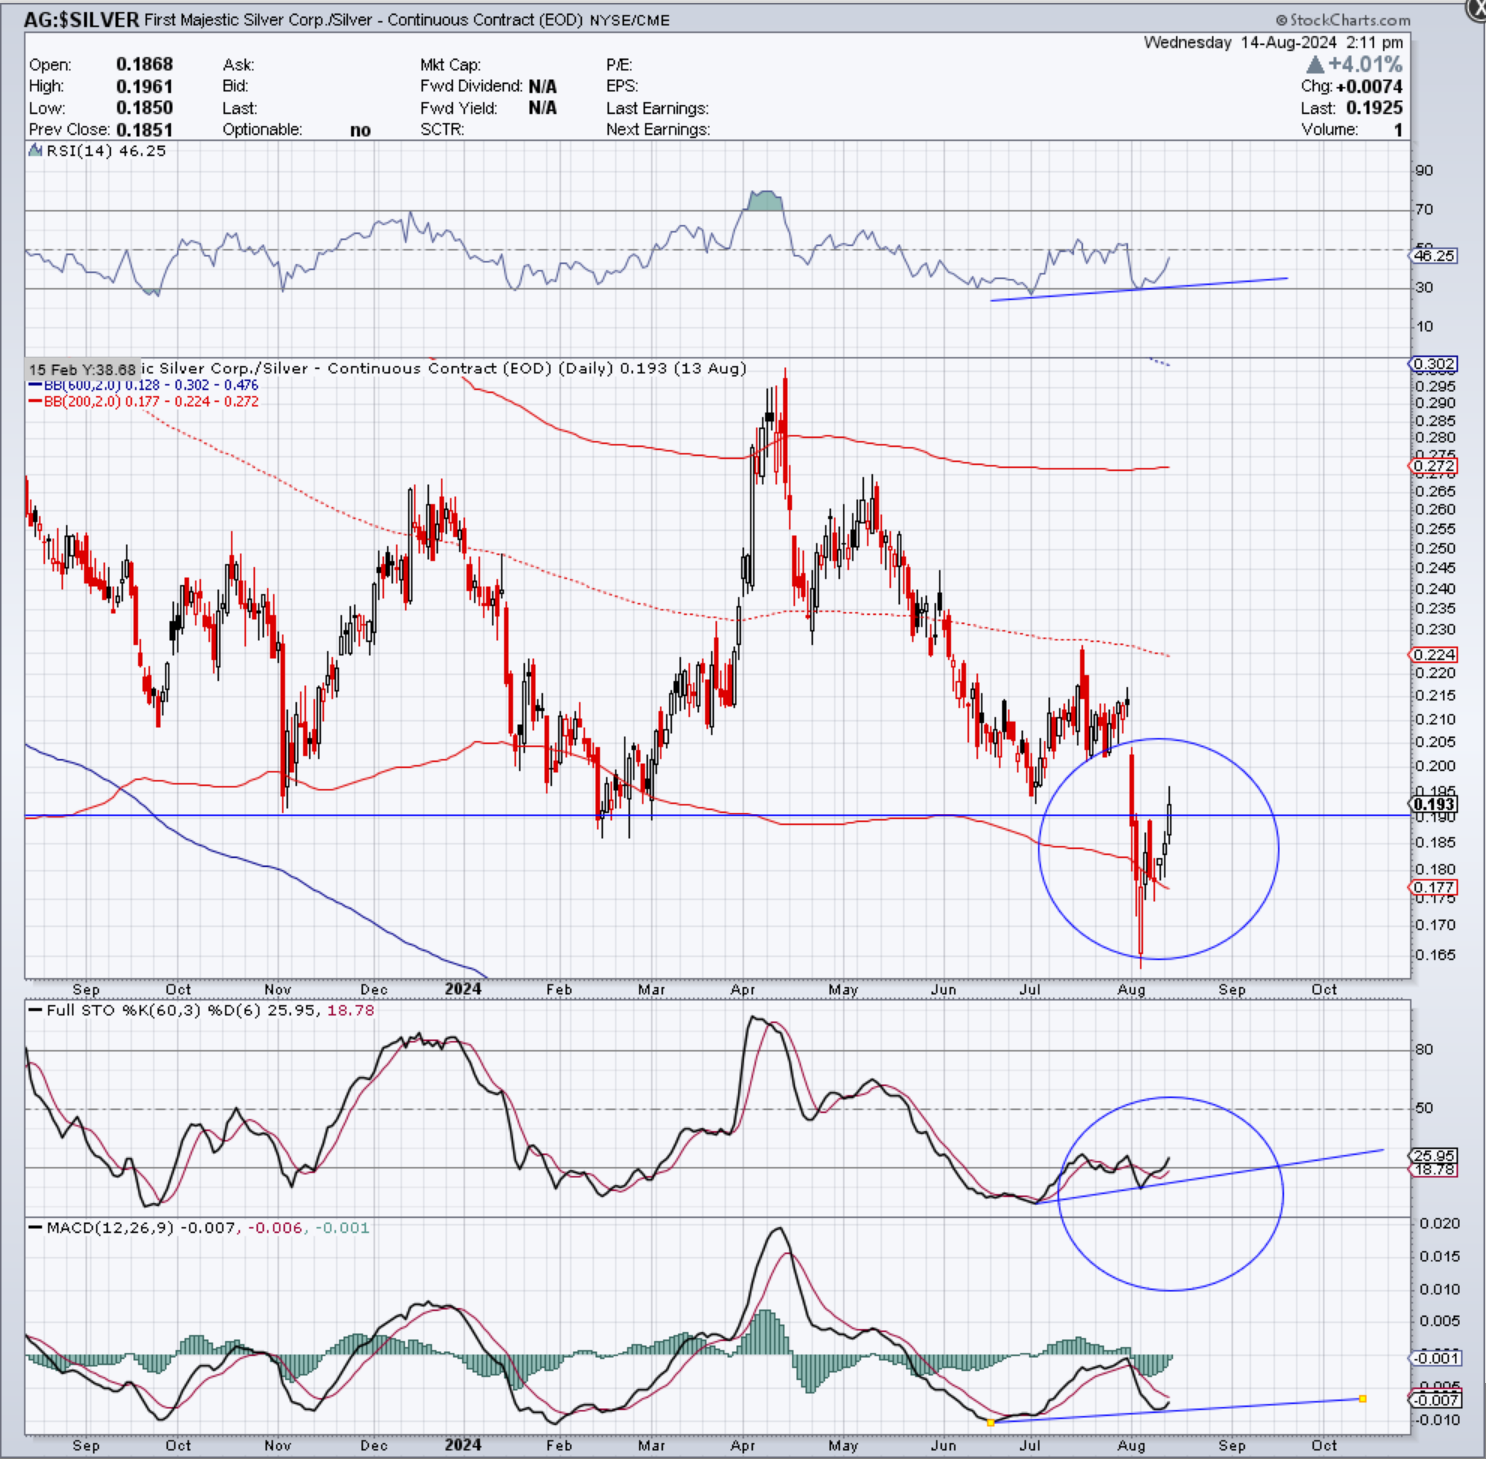
In the daily chart, below, you can see a false breakdown out of the H&S top. Also, there has been a positive divergence in all of the momentum indicators (noted by the trendlines), and the daily stochastics have come out of oversold.
anyone know how to add share float data to these charts?
a share today is no the same fraction of enterprise value as was one from 2010.
just like today’s dollar isn’t the same as yesterday’s.
melting yardsticks.
completely agree. The ratio charts are interesting but not necessarily indicative of trends in the underlying. I mean silver and AG could both go up 10x from here but the ratio would remain flat.