The Agony and the Ecstacy
On Friday last, and even yesterday it felt like the PM bull market was on solid footing. We were geniuses.
Oh sure, the oscillators on weekly charts for silver miners had already peaked out and were on the decline. And yes, there were disturbing negative divergences between the the oscillators and price.
But it’s a bull market, right? So a healthy correction is expected.
Today that breakout gap on SLV below a double top hump is somewhat disturbing. Note that on a gap up SLV formed the first leg of the base of the double top pattern. The gap down from the pattern leaves behind an “abandoned Baby” … a double top abandoned baby, isolated at the peak by a pair of gaps . Right now, to me, it feels rather bearish for silver, and the PMs in general.
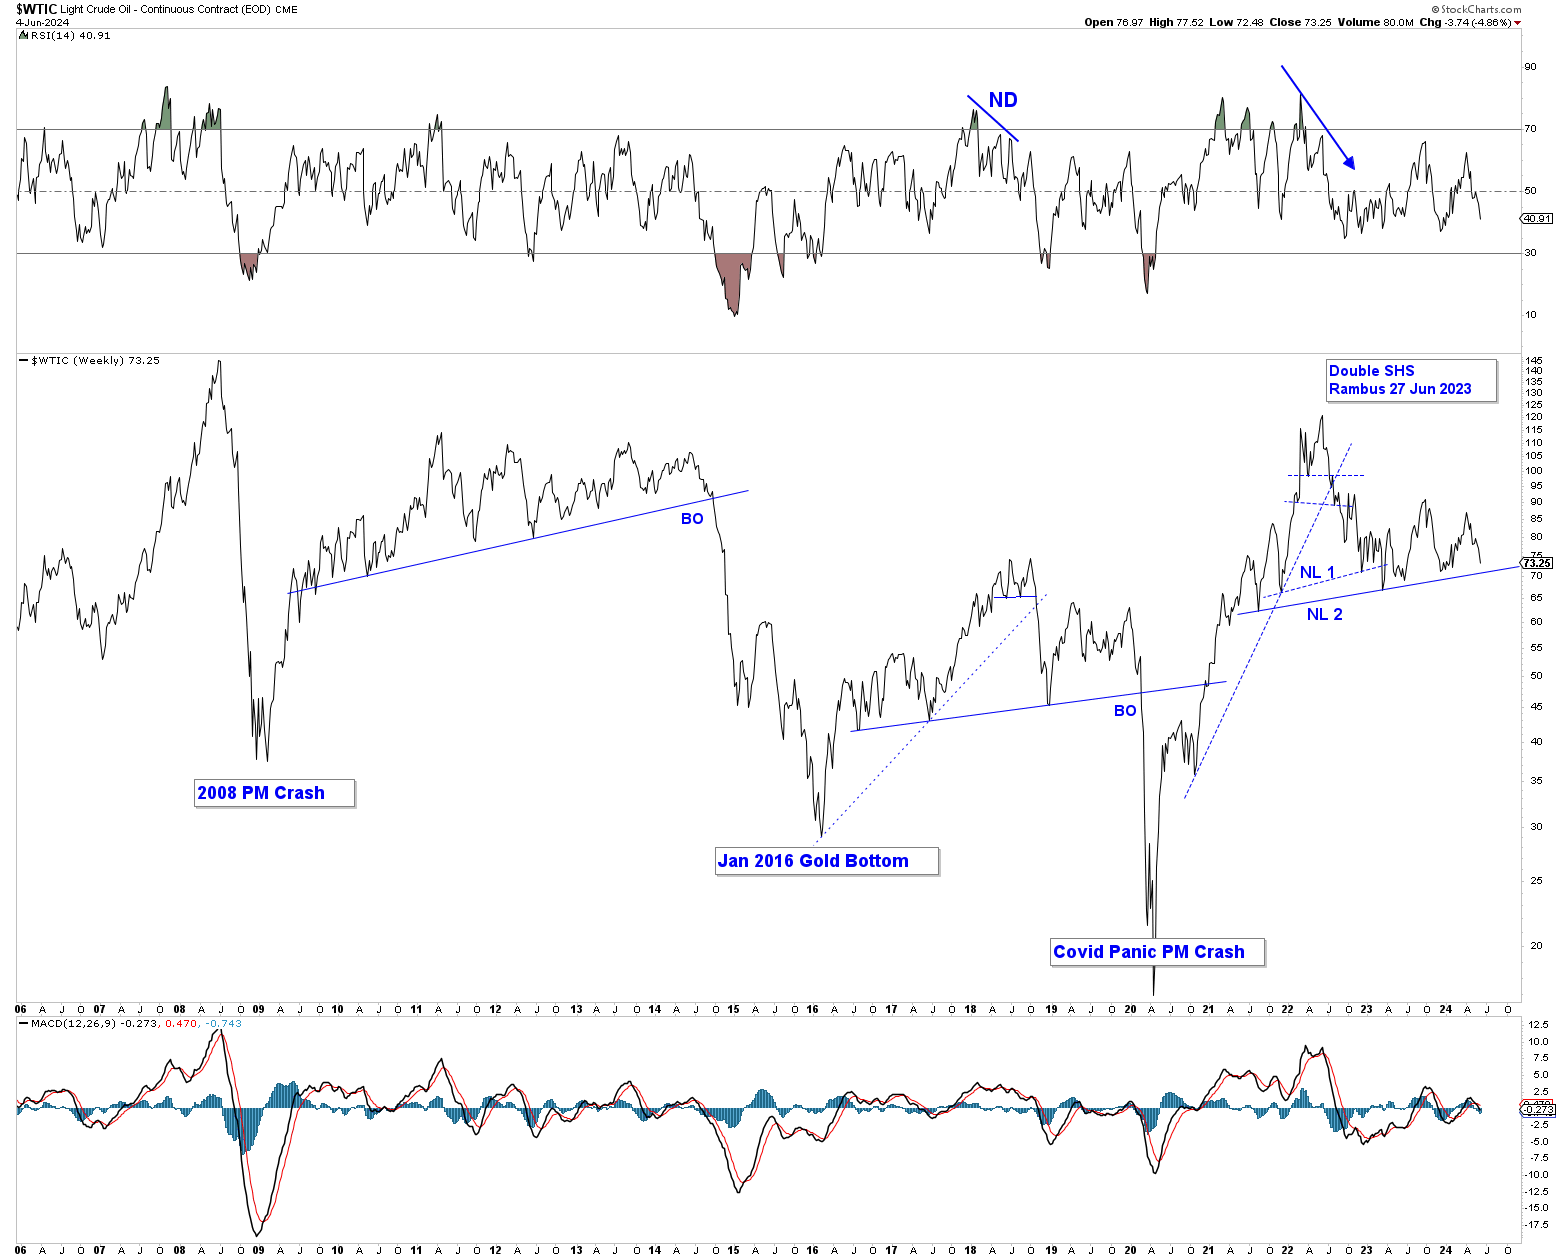
Today in his news letter Rambus discussed a bearish pattern forming on WTIC. This got me rummaging through some my own, almost forgotten, charts for WTIC. Here is one of my very long term charts for WTIC. There are markings on the last pattern in the series that are borrowed from a Rambus chart.
If (or when) the last pattern in the series breakouts to the downside, stocks will experience another deflationary crash. Precious metals and the miners will not escape the downdraft. I am not saying it is going to happen, but I am saying that it could. There are two sides to a coin – danger and opportunity. We need to be aware of and alert to both.
All credits to Rambus 1, and I hope he will forgive me for stealing his thunder.
WTIC – WEEKLY LINE CHART (LAST 20 YEARS)
Good Post Foxy
What do you think of this Monthly 25 year $WTIC Chart
We just Boinked exactly on the 50 Month MA and the 200 Month MA …Golden Cross In process
https://schrts.co/fDkngnzK
Many are expecting WTIC because of inflation to soar from here, and it very well might.
(I’m just going to spitball…)
You could draw a triangle consolidation pattern for the last 1 1/2 year of WTIC. Draw the upper trend line from the tip of the head to the tip of the last rt shoulder. Draw a line under and we have a triangle pattern that is working on it’s 5th reversal point.
Remember that last “Shoulder” on the far right of the pattern is itself a smaller SHS pattern and the decline has not yet reached its PO which is a smidge below 68. By my reckoning that puts the PO right on the neckline of the larger SHS pattern, or a smidge below it.
We know that too much debt is deflationary. Some are expecting a deflationary slump before the final blow off in PMs.
That’s kind of my camp, too, although I wasn’t expecting it until sometime in 2025.
Your TSI oscillator has turned down as it did in 2008, 2016, and 2020 – so no help for the bull case there.
I’m having a hard time making a bull case out of your chart. The 50 Month MA could cross over the 200 MMA, or maybe just a kiss at the moment of the breakout. Why not?
That doesn’t mean WTIC can’t rally from here in spite the ominous look. Sometimes that happens. Maybe there will be a third rt shoulder. Or maybe not. Who Knows?
Meanwhile my Spidey senses are tingling.
That (possible) triangle reversal pattern was also in the Rambus 1 news letter. I had to go back and check.
I still have a 2700 target on gold so its not over yet. Just a pause is all.
Columbia recently posted an EW count for silver calling for the 3 of 3 of 3 of 3 monster move up. I indicated that the count was legit (technically) but that my work wasn’t supportive of such a choice. Incidentally, Sam and Avi are also looking for that, just not quite yet — next month?
But for now, I’m not in that camp. Indeed I see growing risks in the other direction. At the other extreme, Trader Joe has a VERY bearish gold chart recently but he’s looking out a bit further. His outlook lines up with a systemic breakdown (where gold falls, but falls the least). My near term view is one more leg up soon, then a major decline beginning in July/Aug.
My energy outlook is near term bearish still, but it looks to surprise to the upside by mid summer. I don’t always stumble onto EW counts matching my 4D charting work, or I’d post an EW chart or two. (I don’t do my own)
That would put oil down around 40-50. Quite the opportunity