Revisiting Exter’s Pyramid of Risk
The last time this graphic of Exter’s Inverted Pyramid of Risk appeared on Goldtent was in 2017. So today I thought a refresher is probably in order. Those of you familiar with it will recall that the asset classes on the top levels of the pyramid are the riskiest and in largest supply when looking at total notional value.
The bottom of the pyramid is reserved for the most secure assets in all weather. And naturally, that is where we find gold (which is a tier 1 asset on Central Bank balance sheets). Its right below paper money which is still considered one the safest of all classes although lately there are a lot of people questioning just how secure it really is! Silver is not mentioned but don’t be alarmed. Neither is stainless steel sheets, copper pipe, uranium rods, coal piles or aluminum ingots. Gold is representative of physical assets and industrial metals in this context as a store of wealth but we will not forget there are indeed many kinds of stores of wealth that are equally secure albeit harder to carry around in a backpack.
John Exter, the developer of this chart, was an economist who served as a Board Member and one of the Governors of the Federal Reserve System. So he had some pretty good credentials and more insight than the average person. If John said gold was the most secure all all assets then there is little reason to doubt him. We here at the Tent know it to be the truth in any event so there won’t be much debate on that subject.
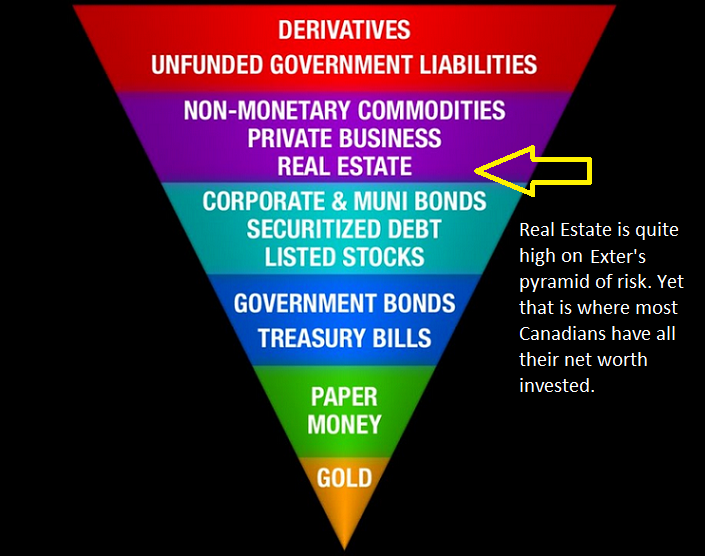
The reason I posted this chart today however was not to highlight gold, but rather to bring attention to the position on Exter’s Pyramid of real estate and to simply point out that is where most Canadians store the majority of their wealth. During normal times nobody would bother looking at such a chart but since instability is clearly on the rise around the globe we need to reconsider just how risky real estate is in the big picture. Don’t ask your realtor about it though. They always give the same pat answers. To them, homes are the bedrock of finance and investing. Nothing else is equal.
But John Exter did not see it that way and his chart demonstrates why. During a crisis, real estate is not in the best of positions. Look lower on the chart for better security of your wealth and less volatility. We need to keep in mind that housing is fundamentally speculative at current price levels. If this were my chart I think I would elevate Canadian housing to an even higher level given the outsize risk posed to homeowners should a genuine economic crisis unfold.
Homes and related investments have eaten the entire Canadian economy. There is nothing else there anymore. Its the equivalent of a monoculture or a farm that only grows one kind of wheat and is subsequently at extreme risk when certain bugs, fungus and rusts appear on the scene. Or when bad weather comes early and stays late. After so many years of seeing prices rise its pretty obvious Canadians think their homes are bullet proof.
But are they? Because when the shit hits the fan….it’s coming for everyone!
Interesting Pyramid Farmer
No debate on Gold
But I would rather have a piece of real estate than a Government Bond
A mortgage says you are a borrower, a bond makes you a lender. There is an important distinction between them regardless of your feelings for relative security. Credit is the money of slaves is how the old expression goes. But those are not reasons why bonds are on the list. The real reason is related to liquidity and ease of sales. Plus you can get in and out of bonds without the need for a realtor!
Some of us do NOT have a Mortgage and some of us live on a beautiful piece of heaven in the woods
THAT is worth more than any fucking “Bond”
IMHO
Ha ha ha! Touchy are we? I would not insult a freeman though. I don’t have a mortgage either. But most do which is why they are all fooked.
Great post, Sir Farmer.
In my Twitter digging excursion tonight, I ran into this about the GTA (Greater Toronto Area) real estate:
https://twitter.com/TdLeaker/status/1692506526903066969
GL
OK, that is interesting. Four million dollar digs though? Are houses that much in Toronto? Holy Fook! But this is likely a story about war coming soon if the Chinese are bailing out of Canadian investments. Since Canada is the number one ally of the US it surely cannot be good news. I wonder how close the war is now that Ukraine is winding down. Wow….glad I don’t live there anymore.
Again, thanks for making me dig some more.
https://twitter.com/FinEconGlobal/status/1693215092345548878
Now, which Canadian banks (and other banks) have issued the largest mortgages, how many billions of CADs etc … next to be dug up!
GL
Welcome GL. Glad you found it helpful. There is more to the story of course. When looking at the various classes we should keep in mind that the lockdowns destroyed thousands upon thousands of small business and in effect took an entire plank out of the economy. After that the government started attacking big business. And by big I am referring to the oil and gas sector, pipelines, fertilizer production and agriculture.
By policy they have made targets of all forms of industry from mining to tourism, shuttered small airlines and hotels and turned mineral claims into parks. Its complete insanity. Yet they ignorantly keep supporting housing and talking up a storm on the topic all the time. These Liberals have strip mined the countries business sector and are now hell bent on taking away even the “Hewers of Wood” category of employment.
Look at fisheries as another example of what policy can ruin. There is no end to interference. All for the environment of course! Only an idiot can believe the country has a viable future with so much gutted out of what once made Canada economically important. Burn it all down seems to be the new motto. Don’t log it….make an example of all that bushland and keep a fake agenda going. The country is doomed while swimming in new migrants looking for the easy life. What a joke! Will they all become coders? LOL
Sad to see a once terrific country go down the tubes with intent.
Glad we left in 1984 (of all years!) because the country was becoming too socialist for my liking. Gad, who thought it would ever come to this? I suppose I did, unknowingly.
By the time its over the population will be completely and totally dependant on government for all their needs. There won’t be diversity in employment. There will not be choices in stores. Incomes will be limited to the level of subsistance that is dictated by Ottawa and food/rent inflation will eat all they send your way. This process is about impoverishment for the purpose of total control over all people. I just heard that in some US State (not sure which) but they are going to cut off food stamps and welfare unless the recipients get vaccinated! That is the future if nobody fights back. Canada is truly doomed. Those who stayed will never get out either. Just like all Communist countries, at the end of the process its about border control and freedom of movement (or lack thereof). I feel for those poor new immigrants who are running there for the good life. They will all be trapped permanently.