USD
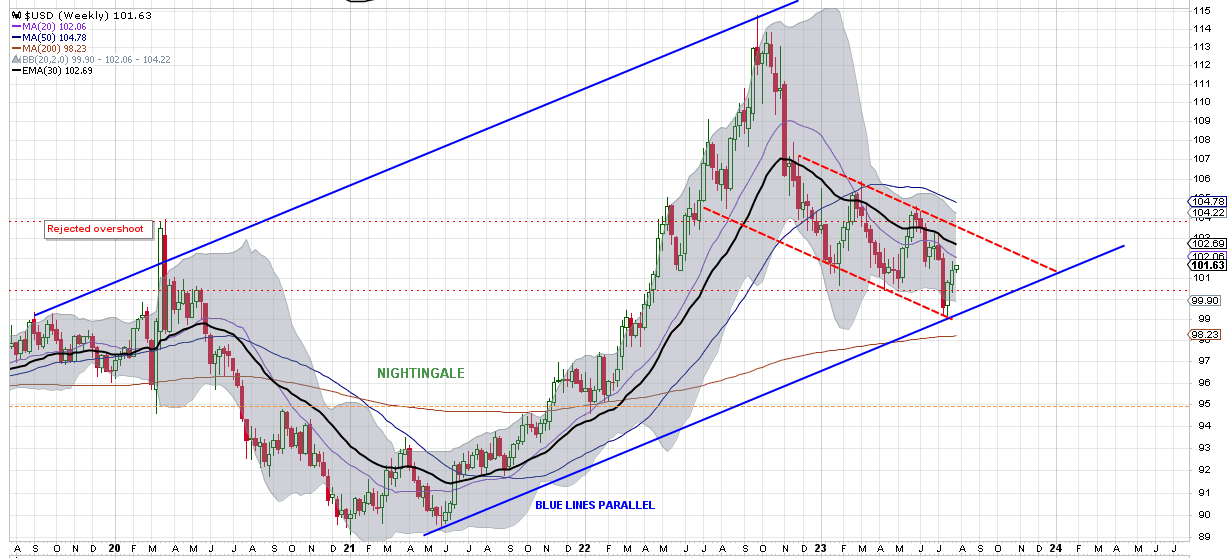
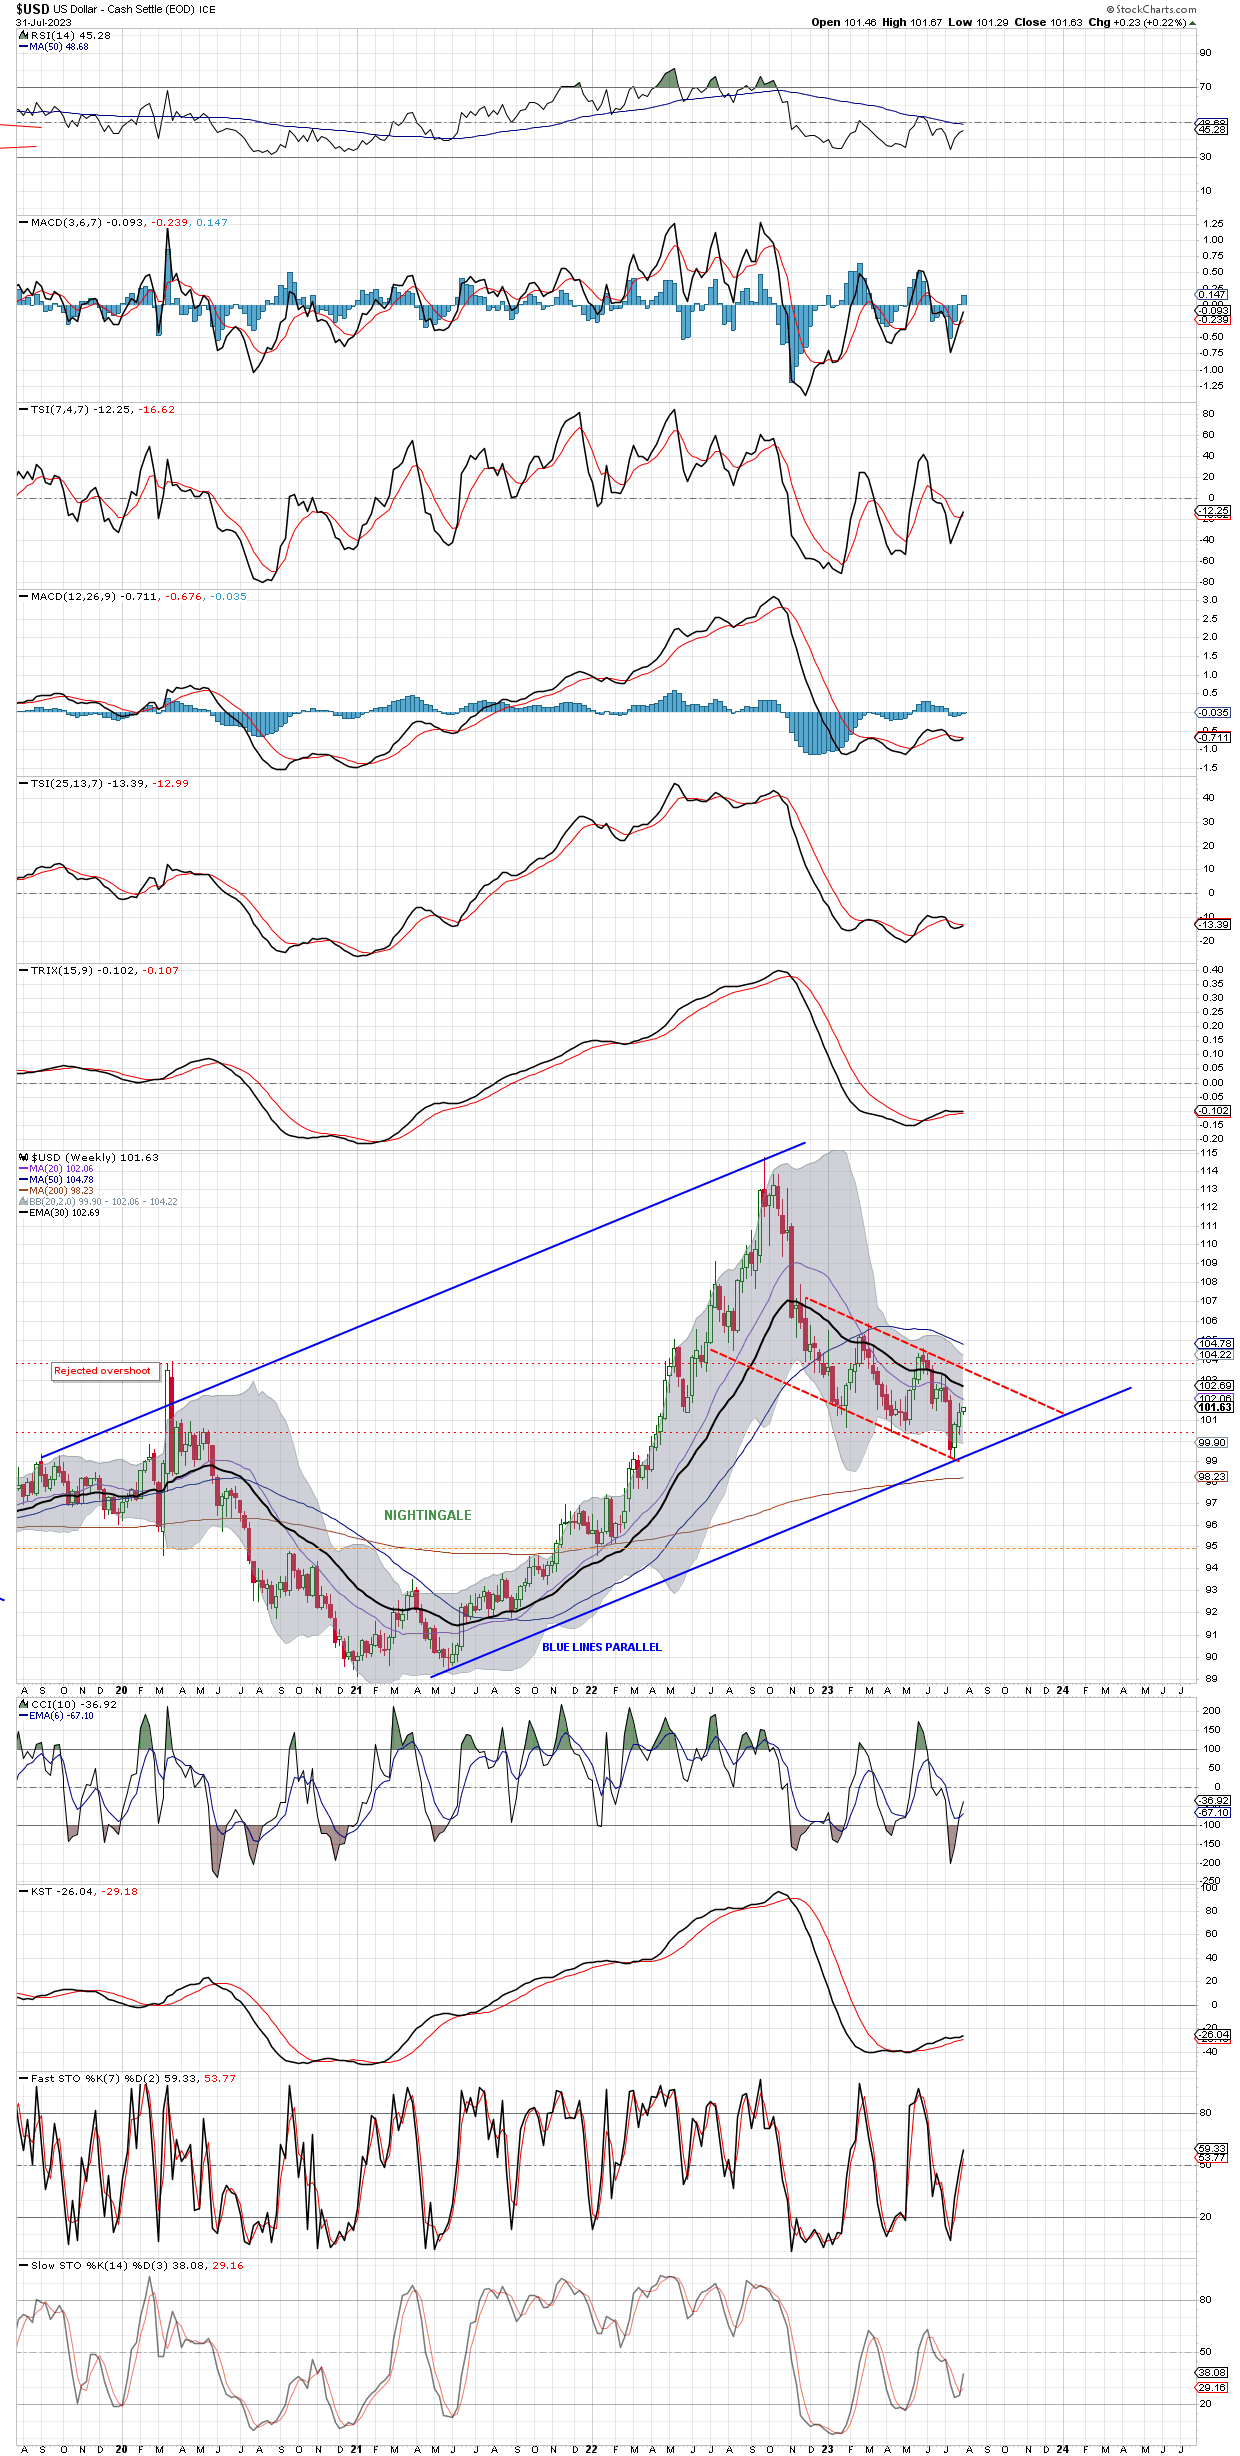
Behold a 4 year weekly chart of USD. USD appear to be in a BLUE Bullish Channel while forming a RED dashed RED Bull Flag. USD dipped 1-cent below 1.00 and managed to gain strength. USD-bulls like to see a weekly close above W-EMA(30) @ 102.69.
When looking at the daily chart for USD, we zoom-in on (assumed) RED dashed Bull Flag (below in BLUE).
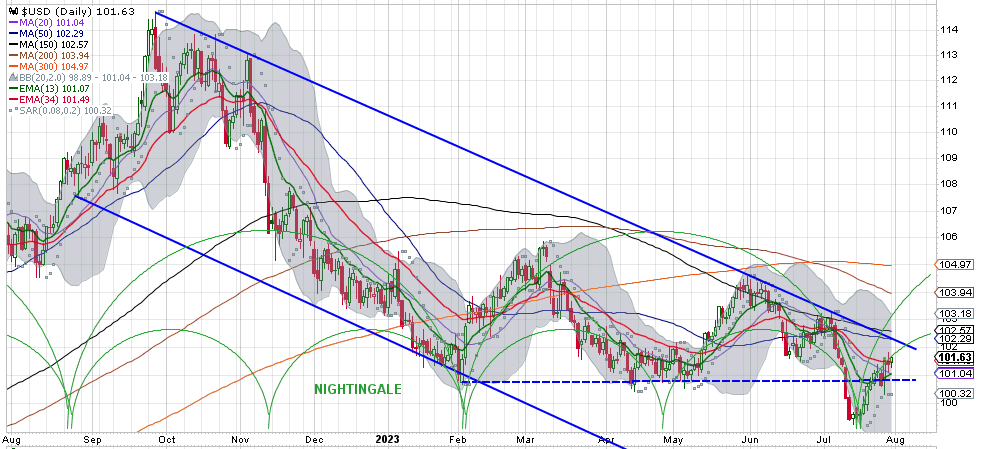
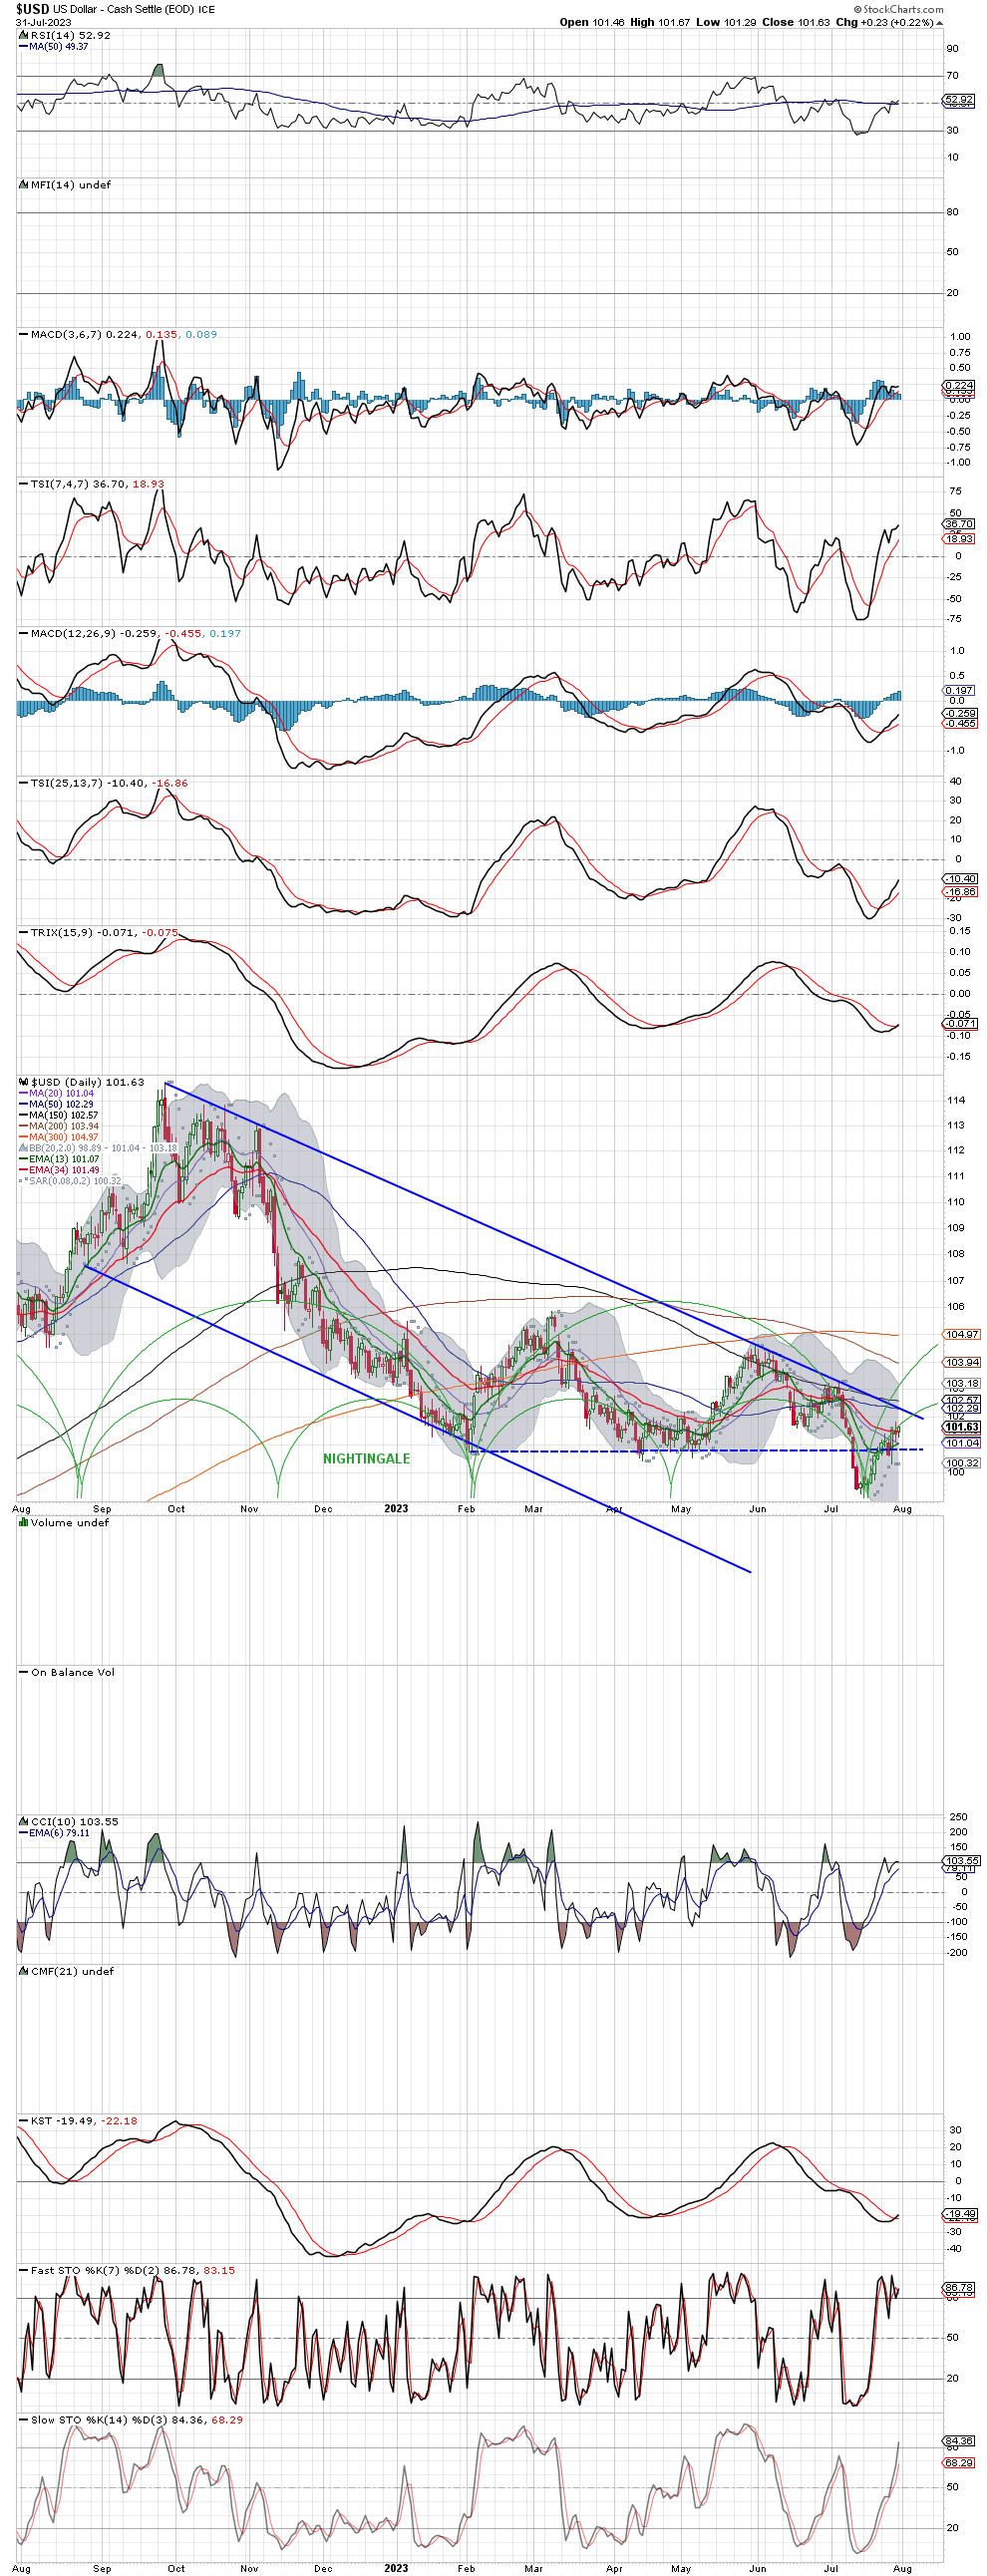
With recent strength, USD getting close for a BO-UP the FLAG. Therefore USD needs to get above both dMA(50) @ 102.29 and preferable above 103 when taken the Flag on the weekly-chart into account. As cycles suggested in former post the 1.00-line did not give any RES and now give support.
The pattern formations of the (assumed) USD BULL FLAG on both weekly and daily chart as well the charted green cycles on the daily suggest a Bull Flag BO-UP gives a high probability; possibly this week already.
IMO.DYODD.