WHEAT
Armstrong made a remark on his BLOG on WHEAT which ‘may’ be lining up with his ECM.
Here my WEAT-weekly chart re-posted.
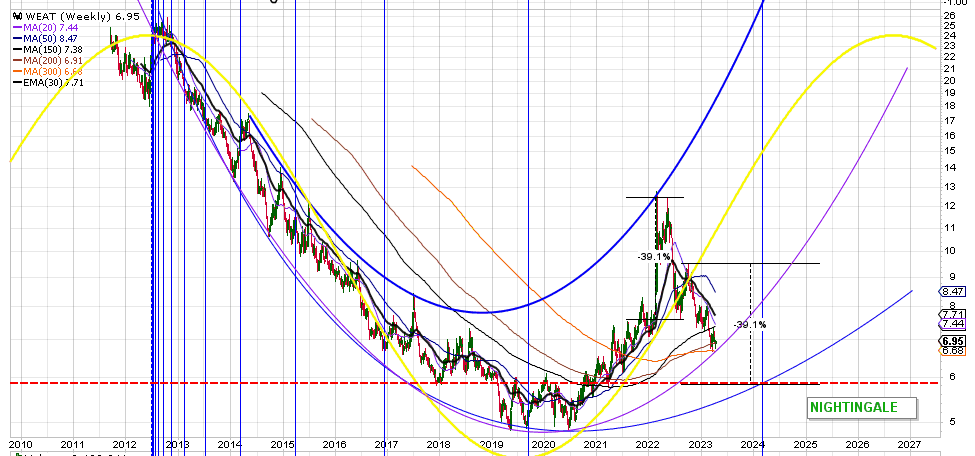
So far the W-MA(200) and W-MA(300) are holding. Observe the expanding PARABOLA’s (P). Even though My initial chart consisted of the upper blue and lower purple P, in last post I removed the purple and replaced it with the lower Blue P. Both lower P (blue/purple) give a match as for tagging old prices. As mentioned before on this forum … P’s have a lot of ‘sway’ and are not easy to set!
That aside … with Armstrongs’ ECM while price holding SUPPORT at the mentioned W-MA’s, WHEAT has potentially touched intermediate Rock Bottom after being cut in half from last high. Add to this the PURPLE P, and WHEAT has a high probability to shoot UP from here. Taking a WHEAT-trade (UP) from here into 2024 has a Chance! Possibly even into 2026-2028 time frame (see YELLOW SINE WAVE)
For a WHEAT trade these W-MA’s and purple P is a WHEAT-BULL ‘line in the sand’ (6.75). If WHEAT BO-DOWN then still WHEAT can decline toward 6-ish (5.87) completing a (2x) 39% halfway pattern.
ADDED:
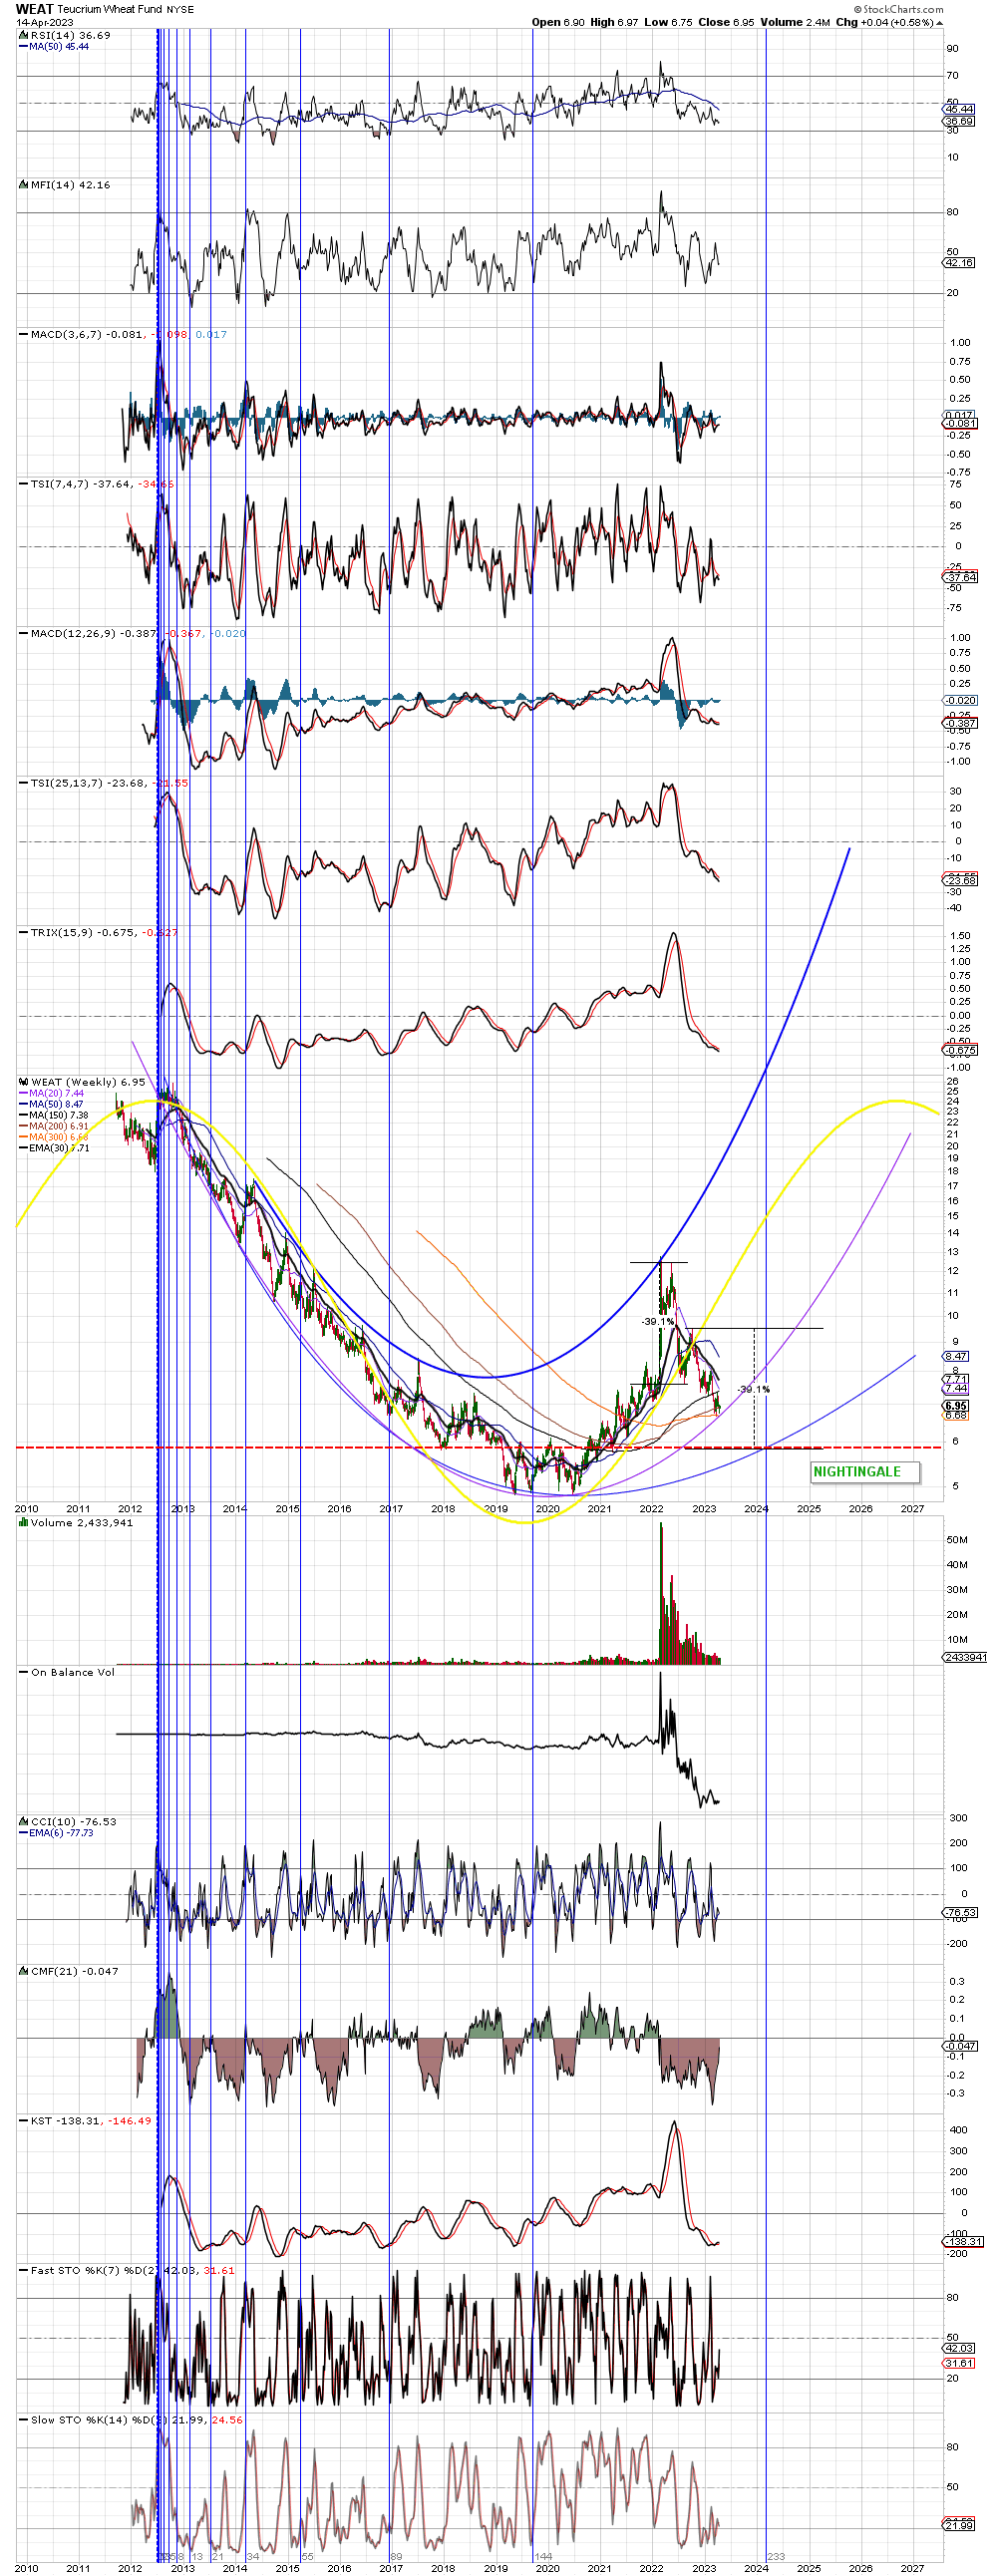
Need to note that related to Armstrongs’ ECM, that May-2024 also is an ECM-turndate and that date more/less meets the Vertical FIB on the chart around March-2024.
IMO – the 10th April ECM-turndate is for the week of the 10th and not necessarily on the 10th. So we actually could/should see as from next week which/what has a ‘turn’. I have my expectations.
IMO.DYODD.