BTC
Indeed BTC made strong move and shows its hand as for assumed purpose which is sort of fast flight to safety in the light of recent banking issues globally. Although I notice the strong moves last weekend, I just wanted to wait it out a little as my chart will make clear.
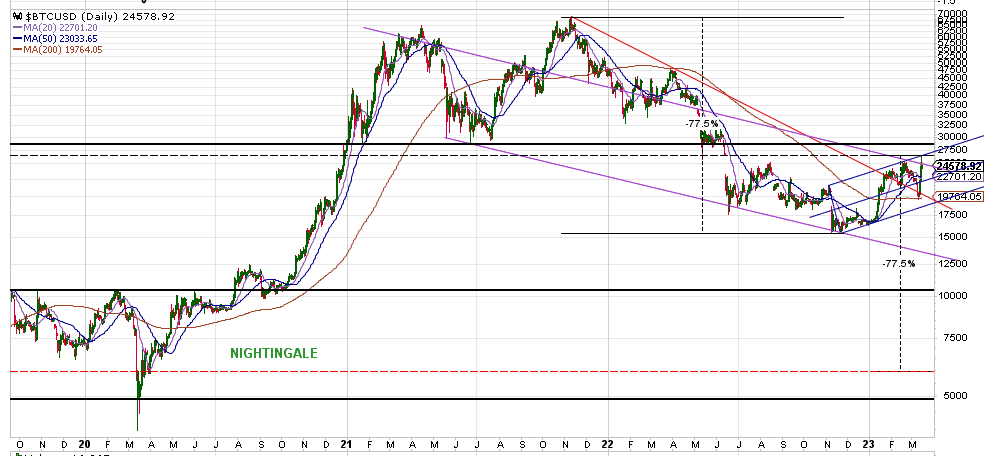
Observe a 3.5 year daily chart for BTC. At a glance one could see a LARGE H&S. Observe a possible misformed downslanting (difficult to note) HEAD and NECKLINE; see PURPLE sort of Bull Flag or bear channel which potentially will fail to the downside.
Well indeed BTC did BO (break-out) its’ 17 month decline. See RED downsloping RES-line from which it BO and has completed a BT. Looks bullish right?! The problem I have (as I see it), is the little BLUE FORK which can be seen as a BEAR FLAG eg. forming MID-point or HALFWAY (down). If such would be the case then BTC will decline another 77% as for measured move with a PO @ 5,600-ish. Interestingly (for me) is that I have these extreme lows target for already 1-2 years. This chart does not includes CYCLES and therefore I will save TIME (as for turning point) for another moment. Such forecast is for all cryptos without any underlying assets and equals the banks have no underlying assets.
Interesting that – as all markets move in tandem – even BTC finished its’ BT on its Horizontal BLACK HEAD from below … just like (my other recent posts) as INDU and GDX potentially completed its’ BT from below finding RES. (resistance). As such is how I observe and see similarity until any of them BO-UP. As long as BTC does not get above 29,000-30,000 I consider BTC in progress of BACKTESTING before going lower while the little BLUE Bear Flag (FORK) possibly restrains price.
As by Design, all those millenia’s believing to get rich being HODLERS and do nothing need to GO BROKE in despair while cryptos crashing to the floor before CRYPTOS rise from the the ashes and make a STELLAR RUN. – IMO.
Although my reports have not (yet) covered cryptos, such does not mean I do not follow them which I do for which I have utmost interesting charts which I will save for another moment.
IMO. DYODD.
That is some impressive chartology!
Thank you Sir!