Gold Reversal Today (going up)
I just ran my technicals on gold. Usually I ignore that one commodity because I have had a love/hate relationship with it for many years. Mostly hate! But if you are a gold buyer then I might have good news. Today is the reversal you have been waiting for and it should take price over 2000 dollars. If you want to err on the side of caution then wait for the start of next week to be certain your weekly candle turns green and has not fallen back. So Monday Feb 20th in other words. The 14th was the actual bottom according to the chart. Nothing in life is guaranteed of course. But this looks good.
I will try to get a chart up tonight if there is time….otherwise tomorrow.
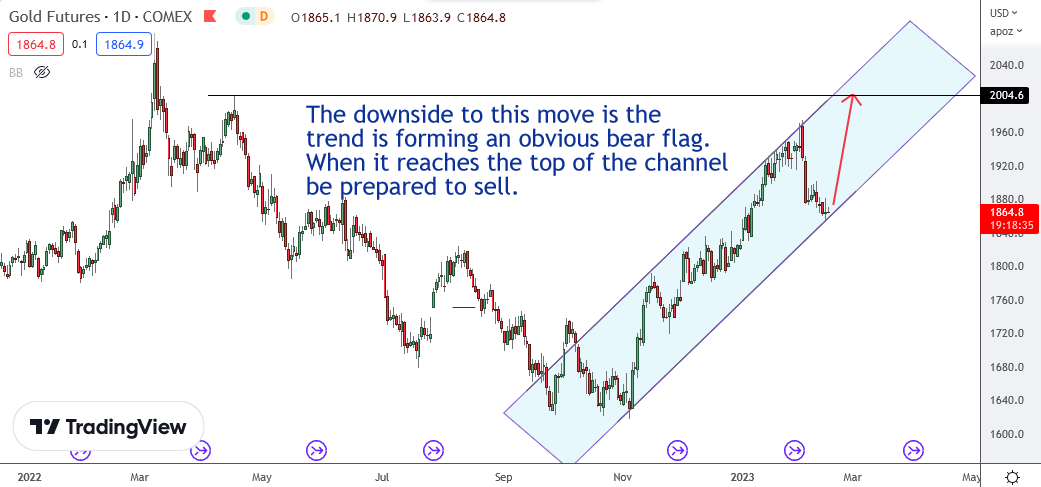
Edit: OK chart is up. Please note that if price breaks below the channel with a daily closing number then it should be considered bearish and its a sell. By that I mean a candle body below the support line, not a wick. All technicals are data dependant and move according to a multitude of different variables. Things that appear obvious do not necessarily happen as you would expect. So nothing is warrantied.
yaaaaayyyy
You Go Farmer
Out of Africa
A Chart is Born !
hehe
LOL thanks Mr Fully! We can only watch and see now. I recommend waiting a little bit just to be safe. Although today is the timer reversal date it is not assured as obvious channel supports tend to get violated because the computers and algos can see them. When that happens the board gets loaded with buys and instead of price rising we will see it break down instead. That is an inversion of price and they defy technicals. We have all seen it happen. The precise opposite of what our favourite technical is telling us is what takes place. Everything can be saying its green to go yet the price setting of the market and the volume of bids still rule.
Many thanks, Farmer!
Anytime. If she break lower I will run an update.
Party Pooper pedro here.
Sorry, yes and no.
Timeframe is everything of course.
Yes, we’re NEARING a upside reversal.
s/t I have c/t deadcat. GLD did close 2c above the 50 so there’s that.
IT we have a weekly doji, but its not Friday.
But when we do get an intermediate degree reversal it will be one to sell IMO.
Longer term .. nightingale and I discussed our outlooks since Dec. but differed on timing. We probably agree by now.
To be specific, I’ll be looking for a lower high (yet again) to short the complex.
On a relatively weak move, I have GDXD shifting into bulltrend mode in longer time frames.
“s/t I have c/t deadcat. GLD did close 2c above”
What does that mean Pedro? I cannot decipher. English is my first language.
“s/t I have c/t deadcat.”
“English is my first language.”
Sorry, english is my second.
Via Google Translate from pedro-ese.
= short term (daily charts for me not 5 min) I have a counter trend deadcat (bounce)
That’s why the PMs are down hard this morning.
My IT upside reversal is still a week or two away.
Hard hit at support today, hopefully just to scare us.
Well you were right Pedro. It was a breakdown. Actually that was my main worry which is why I mentioned it in the thread. The algos really know how to kill obvious channels. All computer driven of course so its out of our control. The good news is it breaks that bear flag formation and creates a different pattern. Looks like its going to drop below 1800 now.
Correction, it will drop to 1824.9 by early next week. Probably Tuesday. For anyone trading futures it was still profitable. I went short once it breached the line and had obviously broken down. So no problem at al. We just roll with the punches and not try to make the chart fit our belief system. The great thing is having a line in the sand to work with.