Gold miners Sentiment chart update
Interesting sentiment chart on gold miners index.
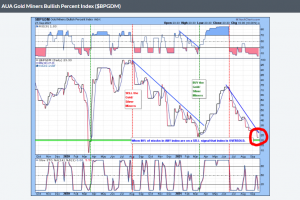
I like the accuracy in the past.
Buy signal (6%) – Mid March 2020
Sell signal (98%) – Early Aug 2020
Buy signal (22%) – Mid March 2021
The next run up got stopped out early (74%) – Mid June 2021.
Now we are nearing capitulation again as we are at 22.5% and about to touch 20%.
Link to the chart for those who want to enlarge/analyse:
https://stockcharts.com/public/1906477/chartbook/236613197
Cheers
R
In October, 2018, when the PM complex started its big move to just before the March, 2020 crash, the bullish percentage was at 16.67. We’re nearly there. If the capitulation in this complex is finished by late November, prepare to deploy cash into this sector.
The public charts at SC are a great resource.
And yes, I think we have a bit more southbound to go, but we’re nearing a good low.
I’ve said before I expect merely a swing trading low, nothing more. But that’s enough for me.
$BPGDM is not a sentiment index. I believe it is more of a breadth indicator. That being said, yes, when it gets to this level is historically low. Single digits on this index would be representative of a crash event.