Silver – The 40 Year Cup & Handle
I and a few others have posted about the 40 year cup and handle formation for the long term Silver chart. This post addresses putting it into perspective to try and get a “handle” (pun intended) on timing and possible price targets. The timeframe from the 1980 top to the 1990-91 bottom was approx. ten years. The bottom formation from 1990-91 to 2000-01 was approx. ten years. The subsequent rally from 2000-01 to 2011 was approx. ten years. I have mentioned previously that the handle is now approx. ten years, which I break down as five down years, followed by almost five basing years. While last year’s rally off the 2020 bottom broke the downtrend of the handle, Silver is still in the handle part of the overall formation. Since the handle formation began in 2011 and every phase of this formation has taken place in approx. ten year phases, one can project the possibility that the handle would be complete by the end of this year or early 2022 at the latest. That means $50 Silver by early 2022 and that is just the point of the actual breakout. This is when the FUN really BEGINS! I don’t know, after a 40 year cup and handle formation, how many years the upside breakout will encompass and what the price projections will be. I will suggest that since the handle had five down years and five basing years, the upside breakout explosion should have at least five years of significant gains. If we say that started in 2020, this is year two, so at least until the beginning of 2025 seems reasonable for the first part of the rally phase.(And given that every other phase has been ten years, it is quite possible the rally from the bottom of the handle could also encompass a total of ten years.) As to price objective, the sky is the limit. I have seen others use the numbers from the bottom to the $50 high and make projections based on formulas for cup and handle formations. Whatever those projections may seem to project to, I am willing to bet they will all prove to understate where Silver actually gets to in these next few years. I am looking forward to “The greatest bull market in financial history”! 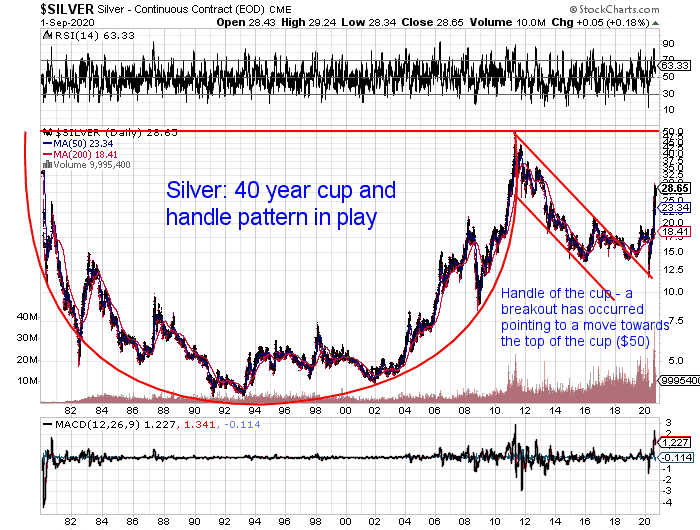 The chart is from One Year ago.
Thank you for that great analysis and insight Sir Chartmaster.
From your mouth to Gods ear !!
My pleasure Sir Rob. I just want to see as many as possible participate and benefit.