Ripple XRP long term channel bottom
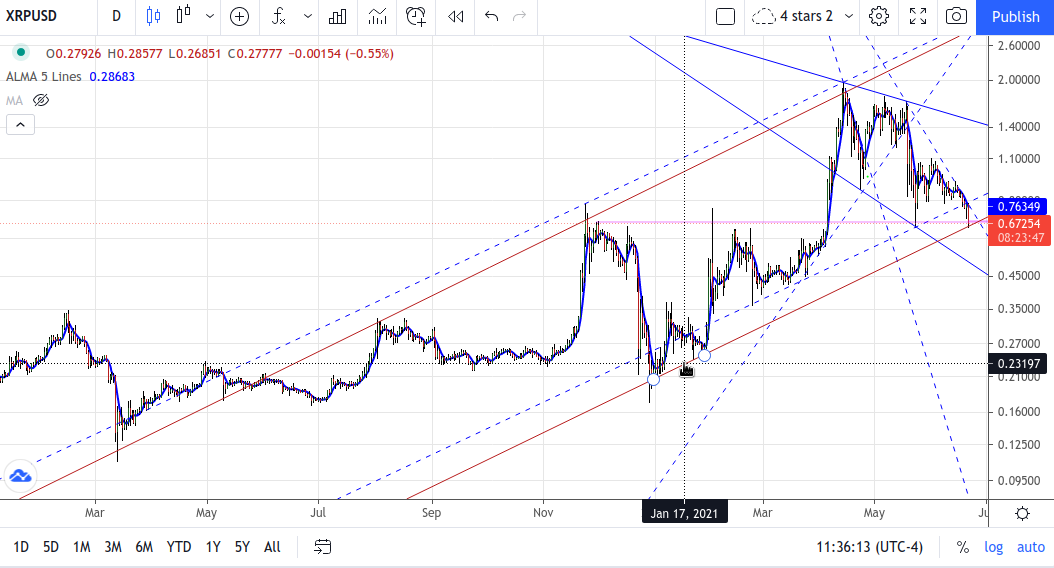
Log chart. The current low price sits perfectly on that red bottom channel line which is drawn from the two bottom bumps in Jan and Feb of this year. Stop me if I’m wrong… but there’s nowhere to go now but up. There ought to be some horizontal support from that purple line marking the tops from months ago and the bottom from weeks ago. Bitcoin is in a similar technical position.
Not sure I understand(will defer to your expertise as these type charts are not my forte). Why is the red support line impenetrable? Would agree that looks like a logical place for support and if you trade this thing a good spot to take a position. Just not sure that the overall chart is bullish and could just as likely breakdown? Wouldn’t you want to see the recent downtrendline broken to the upside?
I was joking a bit about the nowhere to go but up. It just looks like a place of support instead of continued breakdown. And the bottom red channel line when put on the top of the price bars lines up with the three big tops for the last year suggesting a strong channel and more likely to behave that way although price could breakdown and there hasn’t been a break of the downtrend. What you’re saying is probably more sound advice.
Okay, thanks for the clarification.