Silver, is this time different?
The answer is no. But the thing is, there are two very different scenarios that are likely to play out based on history.
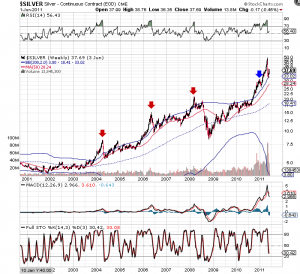
Each spike in the silver price above the 200 week Bollinger bands between 2002 and 2009 (marked by the red arrows) was met with a correction that went all the way back to the 50 WMA. As you can see below, the first two spikes corrected back to the 50 WMA and were followed by lengthy consolidations where it took around 1.5 years to finally break above those spike highs. This would be the first scenario silver could follow.
The second scenario is represented by the intermediate cycle peak that occurred in 2010 around $30 (marked by the blue arrow). Instead of testing the 50 WMA, it consolidated for a few weeks and then came down to within spitting distance of the upper 200 week Bollinger band.
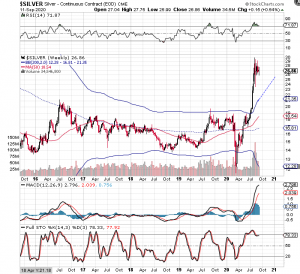
Gold is due to make an intermediate cycle low within the next 4 weeks, and gold and silver typically bottom at the same time. If silver follows the first scenario it will likely crash back down to test the 50 WMA, which will probably be around $20 by mid-October. If this scenario plays out I would expect silver to take a long time to make a higher high–likely over a year, just like after the spikes in 2004 and 2006.
If silver follows the second scenario, it will come back down to get within spitting distance of the upper 200 week Bollinger band. If we assume silver’s low comes in mid October, the upper 200 week Bollinger band could roughly be projected to be around $24 at that time (see dashed blue like in the second chart). So maybe silver drops $1-2 between now and mid-October. If it follows the 2010 analog, silver should then make a significantly higher high perhaps even getting to $50 or more.
I am a biased long, so obviously I would prefer the 2010 analog. Rambus pointed out that these types of impulsive moves take about 1 year to play out, and so I would expect the next intermediate cycle in silver to peak sometime in February or March 2021, hopefully at or north of $50.
Very nice commentary. I tend to think scenario II is closer to what plays out. Silver is a wild beast its so hard to get its moves right.