GDX may need to consolidate more before a break out….
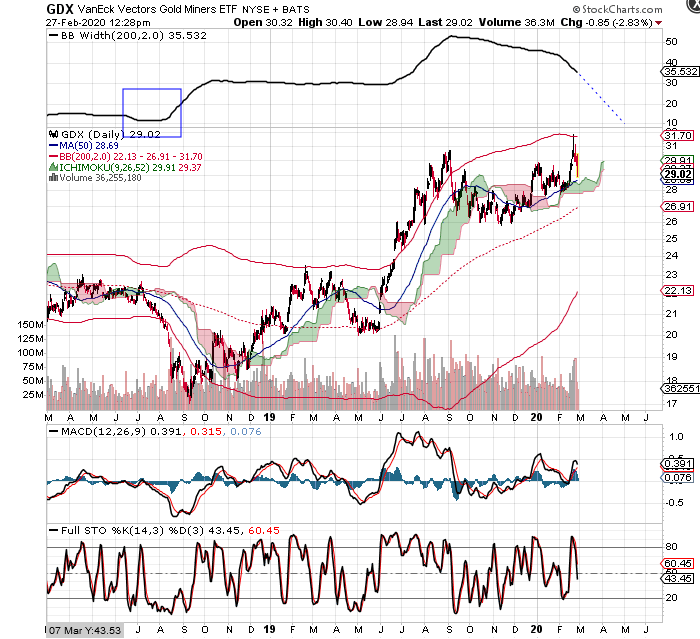
I like looking at long term bollinger bands on the daily chart–specifically over a 200 day period. As you can see in the below chart, the bollinger bands are still quite wide based on recent history, but are rapidly narrowing. Now, this is by no means 100% foolproof, since it’s possible to get very large rallies even if the bollinger bands are wide. However, the fact that we have already begun the narrowing phase leads me to believe that GDX has more work to do before breaking out.
The bands are already getting close to how narrow they were at the beginning of the large rally that started back in June 2019 and should actually match that width within a few weeks. But if we wanted to see the bands really narrow, into what I would consider “baseline levels,” then that won’t be achieved until late April 2020 based on the dashed line projection in the chart.
Keep in mind that a bottom can be reached and a new bull trend initiated while the bands are still narrowing. If I was very conservative and was looking to get long, however, I would probably wait until the bands narrowed to baseline before buying.
It’s certainly within the realm of possibility that GDX will test its rising 200 DMA before finding a bottom, but we will have to see.