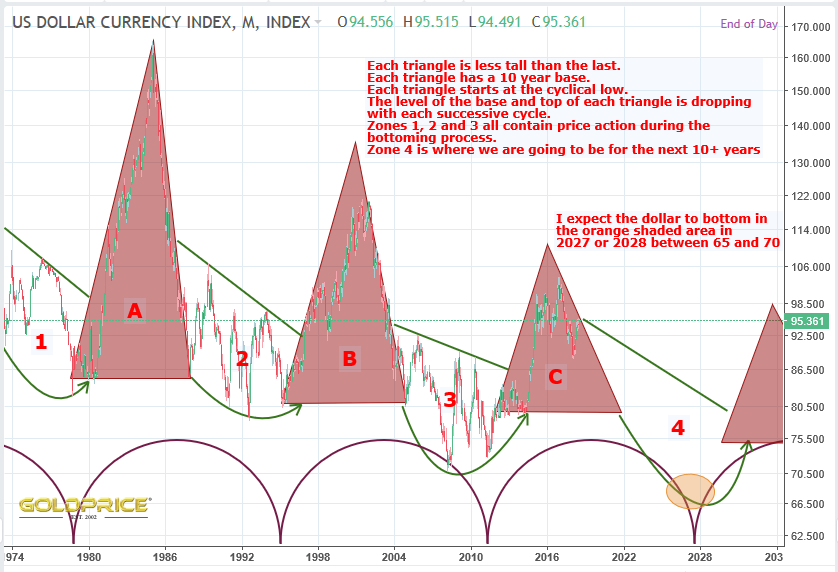
Visualising The Dollar Cycle
Charts are full of patterns, many of which are conflicting, especially in the short term. I find it useful to remind myself of the big picture at times like this. The larger the pattern, and the more reliable it is (historically), the more likely it is to continue. Of course, the Dollar/PM/Commodity cycles could break. This is analogous to the weather over the last 10/100/1000 years. During any given week, it can get warmer or cooler, wetter or drier. That does not change the fact that as the weeks go by, we will be heading towards Winter and seeing an overall decline in temperatures (in the northern hemisphere). The seasonal cycles continue, regardless of daily and weekly ups and downs. This is caused, of course, by the planets orbit and tilt in relation to the Sun. In financial markets, the cycles are caused by investor behaviour/psychology, with supply and demand a big factor along with a thousand other factors which cause the smaller daily/weekly moves.
Anything is possible. However, I’m of the opinion that global power is leaking away from the US. This is causing a steady decline in it’s cycle amplitude. I’m not sure yet what this implies. From a scientific point of view, the dollar is becoming less volatile (more stable), with less difference between its peaks and troughs. This is the opposite of the current situation in the global climate system, where we seem to be seeing greater extremes, trending towards a ‘runaway’ warming until Planet Earth heats dramatically and natural systems/cycles collapse or feedback loops kick in and begin to stop the heating (e.g. melting ice causes cooler oceans causing increased cloud and lower temperatures). This may well have taken place on Mars (but natural systems were unable to reverse the effect), perhaps caused by a large meteorite strike. Anyway, I digress, China/Asia/India wield greater power than ever when it comes to commodities, trade, PM production/accumulation and sheer numbers of people. Together, I believe they will increasingly circumvent the dollar as a means of trade. The dollars declining influence is clearly visible when you examine all 3 of the post 1970’s (modern monetary system) cycles. From my point of view the chart is pretty clear in what it’s telling us…
Interesting. Yes the breaking of the cycle is possible, probably because of the Kondratieff long credit cycle which could trump (pun intended) the 45 year dollar stepping “downtrend” since 1971/1973 or whenever you take the starting point.
I don’t worry too much about global warming but it’s bloody hot here in the UK this summer (then it was in 2006, 1990 and famously 1976 too). The grass is all brown, everywhere – but it was in 1976 too. Britain was bankrupt that year, too!!
I have a sneaking suspicion that the dollar has broken out of the trend (the falling wedge that started at the 160 peak in 1985) as per other charts posted here on goldtadise. I would “fancy” that the dollar will not post a new low in its next bear market (2018-2024+?) but will slide down the outside of its new channel to around 80 matching the 1992 low, then up, up and away in the next dollar bull (2024ish-2032ish) to 120 or 160. That is totally non-scientific and intuitive on my part.
R e global warming, it would be a great achievement on mankind’s part if we were to mess up the climate in a way that couldn’t be done by Nature in the past 4.5 billion years. My bet would be on Nature. I view global warming as purely “politicized” science. As soon as the annual average dropped for a few years after 1998 it was re-branded “climate change”. Once the temp increased again the term “global warming” has been revived. It’s government sponsored propaganda to hike taxes and make money for an elite few as always, like everything else they push.
That doesn’t necessarily mean that it isn’t true though – but that would just be a coincidence! …
I mean, just because you’re paranoid doesn’t mean that they’re NOT out to get you.
Thanks for your comments Dave. Yes, I work for the UK Met Office and have been forecasting for many years (mainly for the RAF, civil aviation and emergency responders). It’s a whole seperate, and very long discussion. What I would say, though, is that previous heatwaves (like’76) were isolated. It was pretty much just the UK, the rest of the world was average or even below average. Recent heatwaves have been affecting larger and larger areas. This year it’s stretched from the US to Scandinavia, the UK, continental Europe and Japan. Even New South Wales is in drought, and it’s Winter down there ! Our planet is definitely warming (dangerously). Impacts will become extreme unless it stops soon. The cause ? Natural plus manmade in my view. We have certainly added greenhouse gases to the atmosphere in the last 200 years. Simple science tells us what that will do. Earth has experienced far greater extremes, but modern society hasn’t had to deal with it. That is going to change.
Here is the extrememly unscientific graffiti’d dollar chart:
https://goldtadise.com/?attachment_id=432897
Ultimate target might be anything up to 160 (retracement of the falling wedge).
NOBODY does this like Northstar
Wow
Just Beautiful…
🙂
Thanks Fully.
OT I know. Do you work in the climate field by any chance?
I’ve always wanted to know what the “period” is with ice core samples. Can you see every year’s snowfall and analyse it reliably or is it smoothed over many years. That’s crucial if you are trying to look at short term volatility in temperature from 1000s of years ago.
This page from the British Antarctic Survey and even the Wikipedia page seem to illustrate that ice cores can contain data for every individual year, though it can be complicated by summer melting and long term flow of the ice.
The BAS page shows evidence major short term volatility (big changes in mere decades) in temperature from periods 10s of 1000s of years ago. That’s really interesting because that is a precedent for recent action but the reasons might not be the same. 10C changes over 40 years have apparently happened though.
There’s a good discussion on http://www.antarcticglaciers.org lower down the page where a PhD student answers some skeptical questions, so I’m sure there’s plenty of excellent research done with integrity despite the stealing of the science by the politicians.
What would be really interesting is if there were more studies into the shorter term volatility of temperature, ie does the global temperature have parabolic moves and 1987 style crashes? Also, how meaningful is a global “average” temperature anyway? I mean with a million thermometers around the world, how do you calculate and weight the average and how does this correlate to ice core data, etc.?
It would really be great to get to the truth for once.
https://www.bas.ac.uk/data/our-data/publication/ice-cores-and-climate-change/
https://en.wikipedia.org/wiki/Ice_core
http://www.antarcticglaciers.org/glaciers-and-climate/ice-cores/ice-core-basics/
https://www.ncdc.noaa.gov/data-access/paleoclimatology-data/datasets/ice-core
According to the late climatologist Iben Browning, the last ice age ended about 10,000 years ago and then Humans began their long trek North as the climate warmed. It would be interesting to see that cycle to see how long we have before our civilisation will be forced back to the equator.
Things are going to change MM, and mankind, along with planet Earth will have to adapt. Fast.
Great piece. Thanks Northstar!