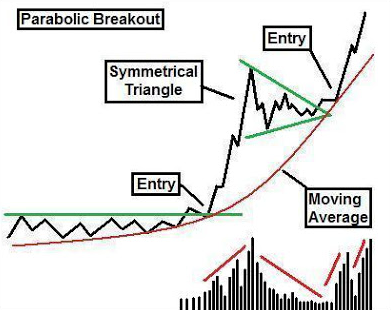
Remember This ?
I posted it last Summer…
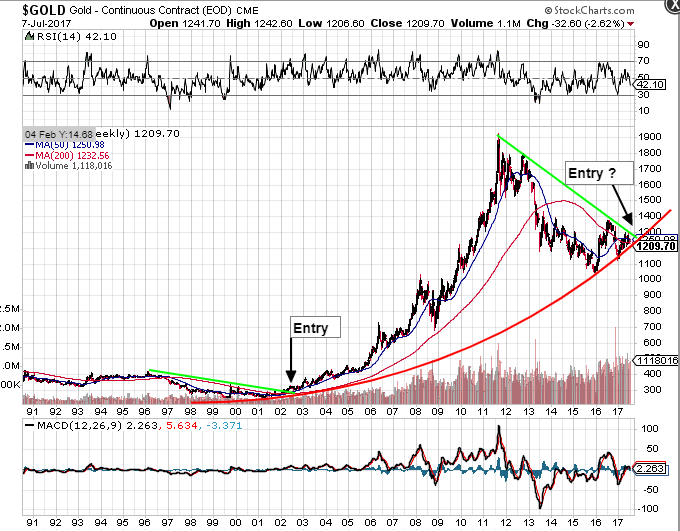
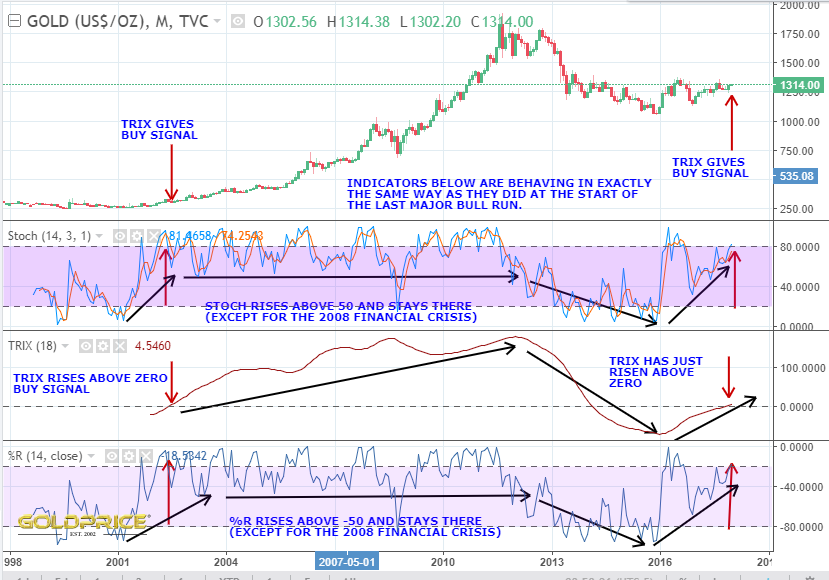
I also posted this…

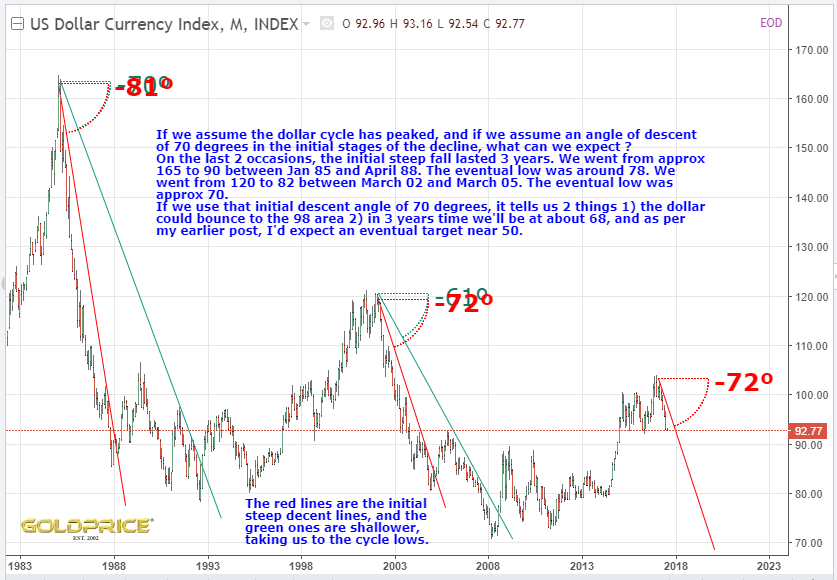
along with this…
all of which led me to speculate with this chart…
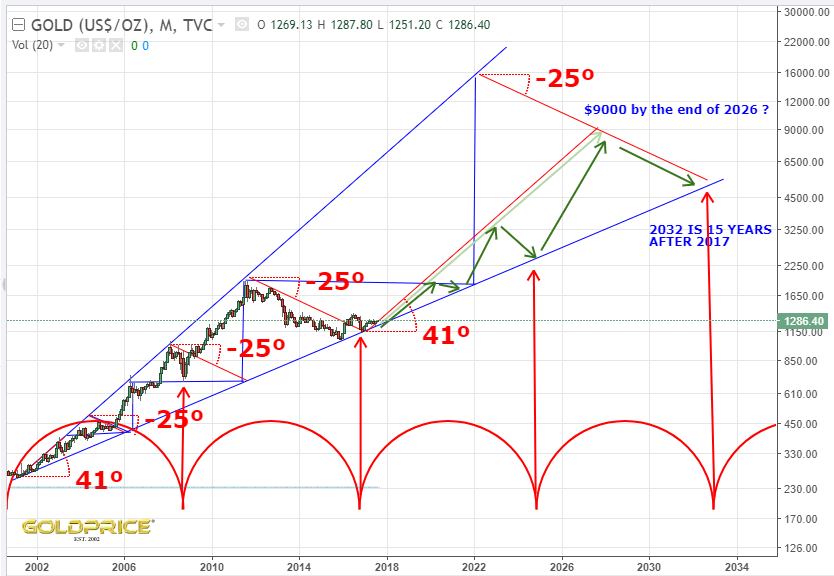
I believe all of these charts are still relevant, and I’ve just taken another ‘big picture’ look at where we’re heading. I’m very much on the same page as Spock, Graddhy, Surf etc, who are proponents of cycle theory. This is what I’m seeing…
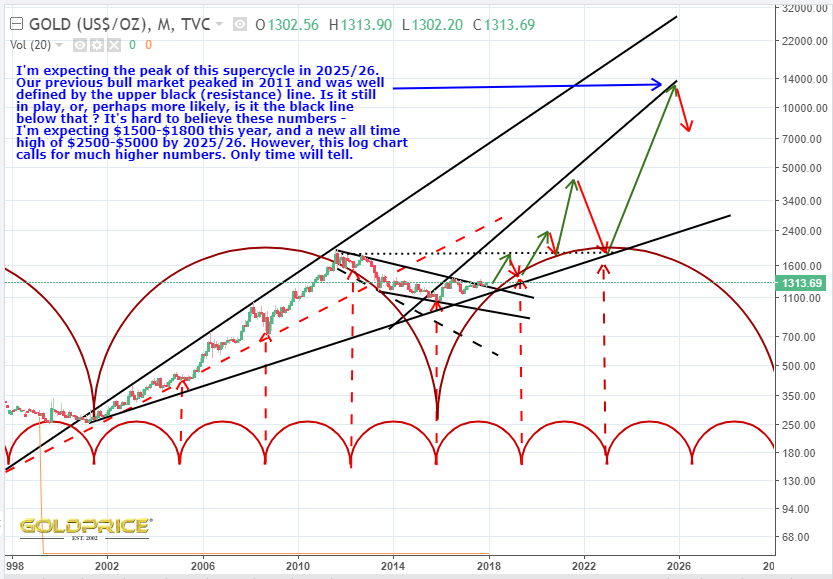
The numbers do look far-fetched at this point. I’m less confident about specific numbers/targets than the fact that we are going to see large/very large gains in the next 7 or 8 years. We’re short term overbought on many of the indicators right now and a healthy pullback can be expected sometime in the next few days. Long term chartology seems very clear to me though, and unless important support lines fail, I have no reason to doubt the thesis that we have a very large cyclical bull ahead of us, peaking sometime in the 2025-2026 timeframe.
Thanks northstar. That’s a great presentation of the big picture.
your near term numbers are certainly realistic if the $US plays along, time will tell. Be ready for anything IMO. Imagine the ramifications of a $50 USD Index the SM would need to nearly double just to stay on par. Inflation and interest rates well who knows?
In the previous Gold BM’s started as the $USD index reached 80 or less for an extended period of time but there is not much data to look at? I still look at Gold as a currency play until 80 breaks but I watch it daily. The SHTF or as you say Beach Ball effect.
my question is paper or physical or what? (EURO or EM) to preserve wealth?
Great charts. Thanks.
Awesome and agreed.
You go Northstar !
Great Forecast
NS:
Congrats on your accurate prediction of weakness into the end of 2017. It’s interesting that the weakness was, at least by my vantage point, relatively mild. Do you think that is presaging a unusually strong uptrend from here?
Jim
Very good work –
Thanks for the comments. To answer Jim’s question, I think we just ran out of sellers and, importantly, time. The COT figures are healthy again (although thst didn’t concern me). I do think the rally this year is likely to be impressive. Not for any fundamental reason (of which there are many), but because the charts are pointing to it. I expect $1500 gold in the next 6 months and $1800 can’t be ruled out by September/October. The miners should double at least.