AUST $
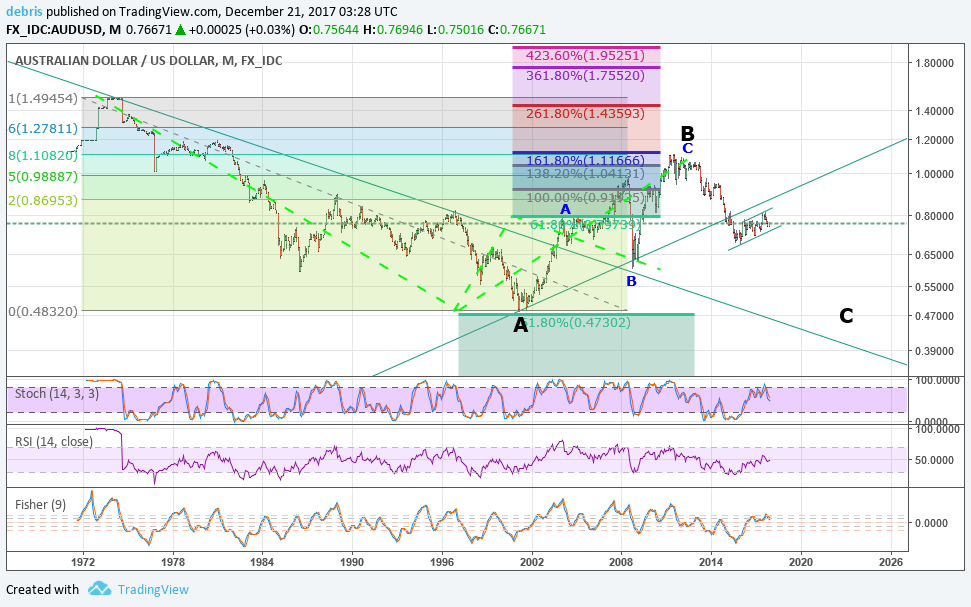
I just wanted to point out some Fib relationships on the Aust$ looking at all data.
The point labeled black B is the 61.8% retracement of the decline from the high of the float to point black A. Black B subdivides as an expanded flat where blue C=1.618* blue A
Black C will likely form a double bottom at 47 cents in 4-5 years
The ascending trendline drawn through monthly closes has been broken and black wave C is currently in a bear flag
This chart, along with the Yen chart looking at all data from its inception lead me to believe we will see a stronger dollar over the next few years
Gold can obviously be traded from the long side on a shorter term basis and the A$ could move up sharply and remain in the bear channel. However I do not see that a long term bullish view on commodities can be drawn from this chart unless the pattern significantly changes
Thanks Ranchida
I am not an EWaver but I agree with your concern unfortunately. I have been posting this chart
https://stockcharts.com/h-sc/ui?s=%24XAD&p=M&yr=20&mn=0&dy=0&id=p87317819207&a=541621657
100%
Give me a Fiat that isn’t weak. I have more confidence in the Ruble than some of this G20 Fiat. The $US may stagnate sideways or up because there may be no better option IMO? I’m seeing sideways till the next 2008 type event just my .02 then you better have your $hit together. Debt will be the demise of the common man IMO. A debt free man is a free man, are you free?
The US has perfected this cycle of cheap credit followed by a sharp rise in rates leading to a liquidity crisis. Money rushes into T Bills and the SM and the $US climbs. Can it happen again or is the scheme over? The US has tried to bleed China for the last few years but it didn’t work as well as previous attempts.
https://www.goldmoney.com/research/goldmoney-insights/americas-financial-war-strategy
N Korea, Iran just part of the chaos plan. Sure looks like a standoff between Germany and the US with interest rates. Germany knows the US can only raise rates so high until they default. Germany is keeping rates at 0%. Who’s going to break? The money flow into the US is starting to slow as seen in the SM. Will rates in the US go higher even into the next recession, I don’t know if the US can lower rates without the $US puking. Previous Gold bulls started after the $US puked around 75 $USD Index. Or will the European Banks cave before the $US defaults or pukes, and the $US, SM, and T Bills go to the moon? Or does China step up and make the Yuan play?
Great article, thanks for posting. This tax cut was probably part of the strategy to boost us$ investment so we may entering the us$ revival phase now
It makes sense that South Korean and Japanese pension fund investment in the US would be given a boost with domestic geopolitical and currency uncertainty rising
Your perspective is always appreciated Ranchida…Biotech still on target…