NOTHING LASTS FOREVER
My variation of Fully’s (h/t) chart:
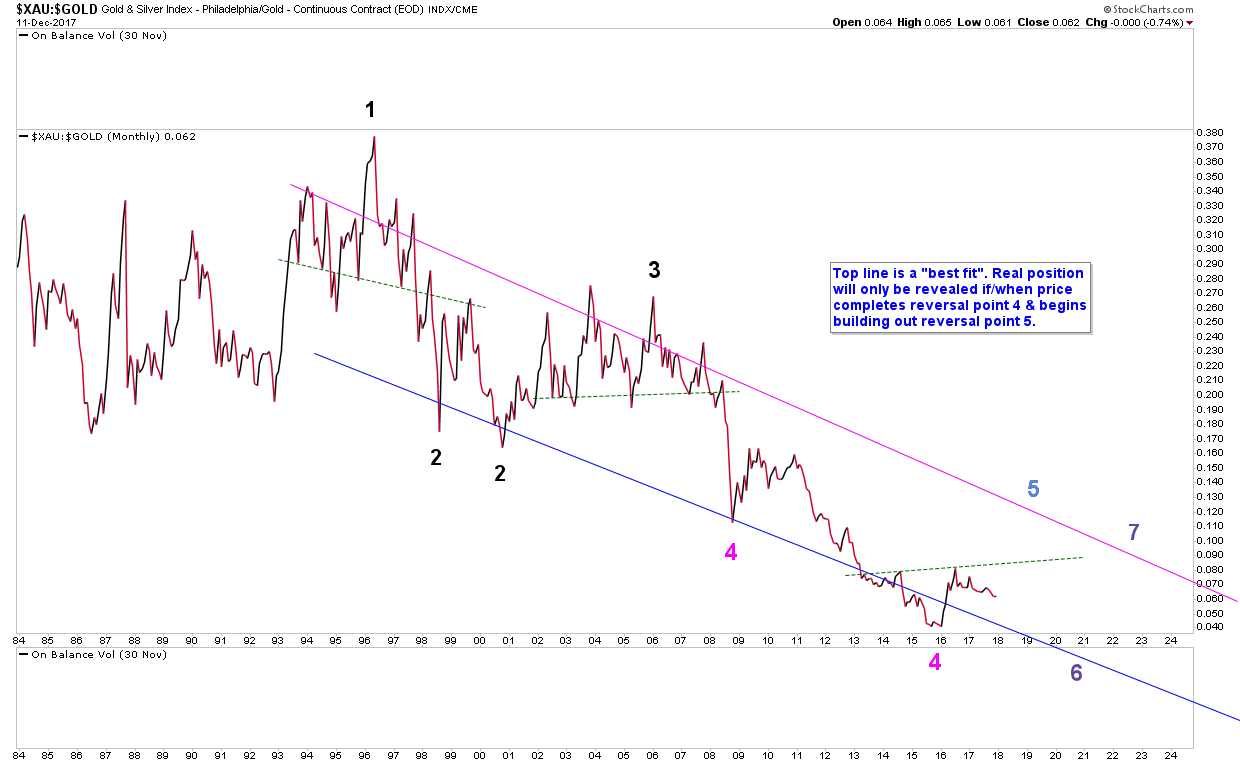
The scenario that fits the above chart is:
- 2018 – War (Korea), price rallies up to reversal point 5.
- 2019 to 2020 – GFC 2.0 (trigger/s undefined), price falls back to reversal point 6.
- 2020 onwards – QE to Infinity. Price rallies back up from reversal point 6 to reversal point 7 and breaks out there. Thereafter, another 10 year rally begins, this time in “everything”, because the rally is being primarily driven by currency debasement.
- 2030 onwards – US loses reserve currency status, all globally traded commodities, including gold and silver, switch to being denominated and traded in the new reserve currency. Change happens within 24-72 hours, leaving the average guy on the street with his head spinning.
Nothing lasts forever and if you keep printing money, with no backing behind it, people eventually lose confidence in it for that reason alone. Happened in Ancient Rome, Weimar Germany and countless other places at different times. In that respect, the US is most definitely *not* exceptional IMHO.
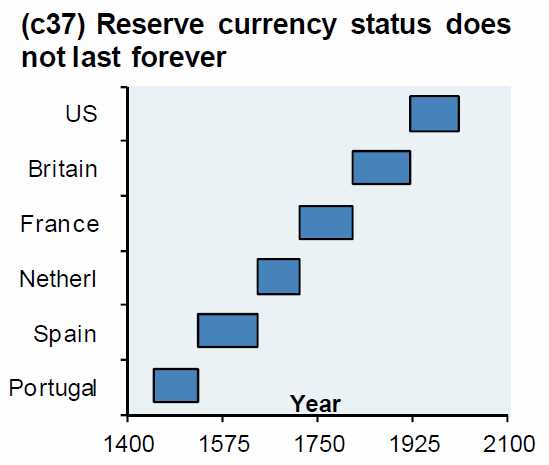
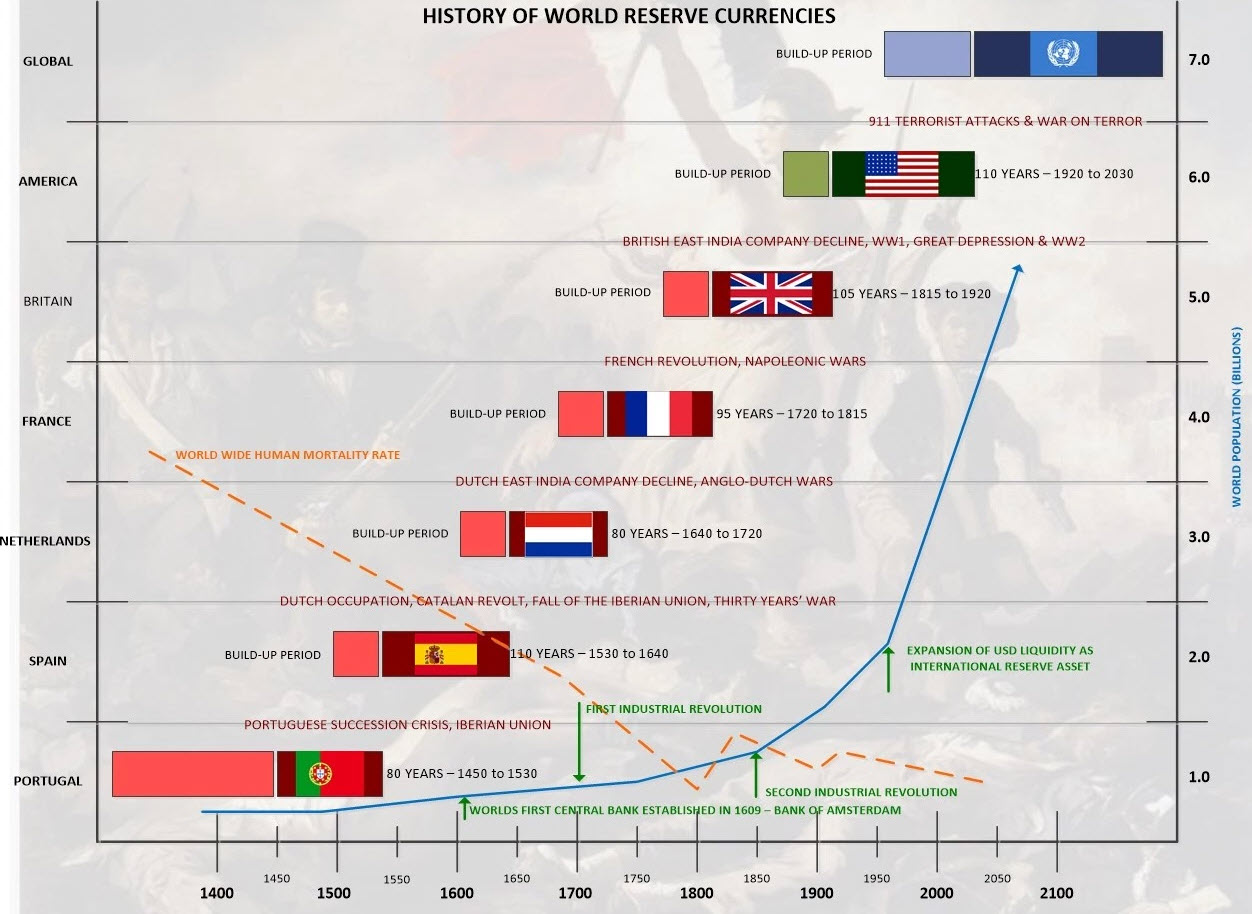
Those 2 Bottom Charts are stunning Sir Jenkins
Thanks….real keepers
Global is next ?
maybe….or maybe China ….or Jamaica even
I ripped those last 2 charts off from ZH but they do tell a tale.
Probably China next.
This is such an important set of charts and interesting theory Jenkinslane , I changed the title and saved it at the sidebar.
Food for thought !
Thanks Fully.
Interesting theory JL. I tend to agree with the overall theory still digesting it all but my immediate reaction is the Euro has been trying to accomplish a similar agenda since it’s inception. Europe was even buying Oil in Euro’s and Gold. The two countries selling Oil in Euro’s and Gold got wiped off the map go figure? And amazingly enough two wars broke out it in Europe – Bosnia and Yugoslavia and now Syria has been flooding Europe with refugees destabilizing the Euro. Brexit icing on the cake. China has received the message loud and clear and if there is war it won’t be good for anybody IMO.
The Euro will fail IMHO, it’s just a question of when.
The EU elites do want to create a United States of Europe and they thought the Euro was one of the steps towards accomplishing that goal.
The citizens of Europe do not want a United States of Europe, which is one of the reasons why the EU elites are so keen to flood Europe with
migrants, who will always vote left wing (more free stuff), and the left always wants “more” Europe, i.e., to move towards a USE.