Looking Down As We Go Up
As I’ve said many times, I believe we are still in the early stages of an exciting new gold bull. I’ve also said that as we march upwards, I’m going to be looking down so that we don’t panic every time there’s a normal correction/consolidation.
Spoiler Alert – I think we are going back to the $1260-$1280 region by December
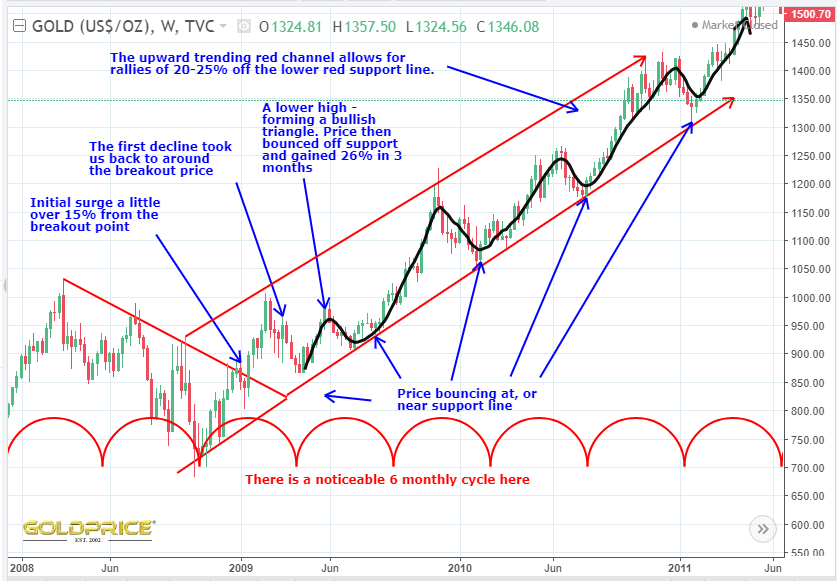
I’ve been looking very carefully at the most recent point on the gold chart that fits with where we are today. That’s the breakout in 2009.
The following chart shows that period and what followed. This is really important, because if, as I believe, this is a good guide, it can give us some really useful clues about what to expect if we have a healthy bull ahead of us.
Superimposing all of that onto current price action gives us this as guide…
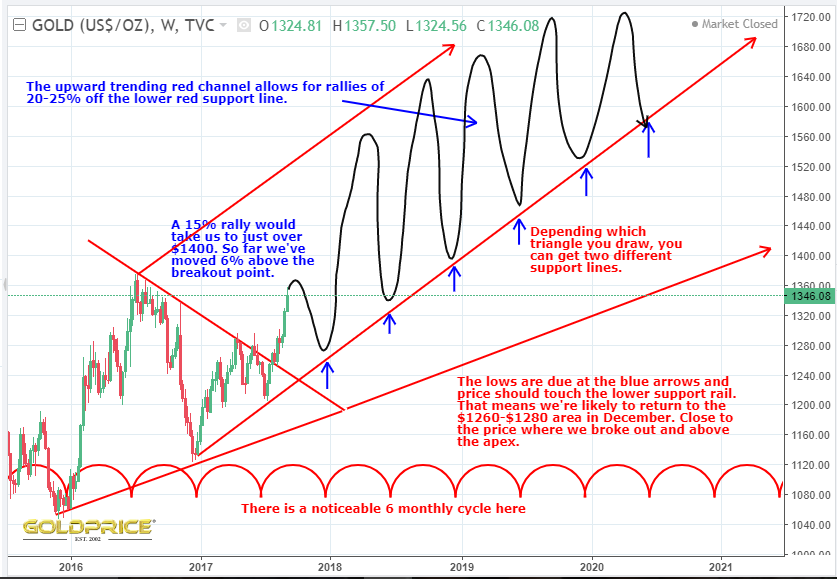
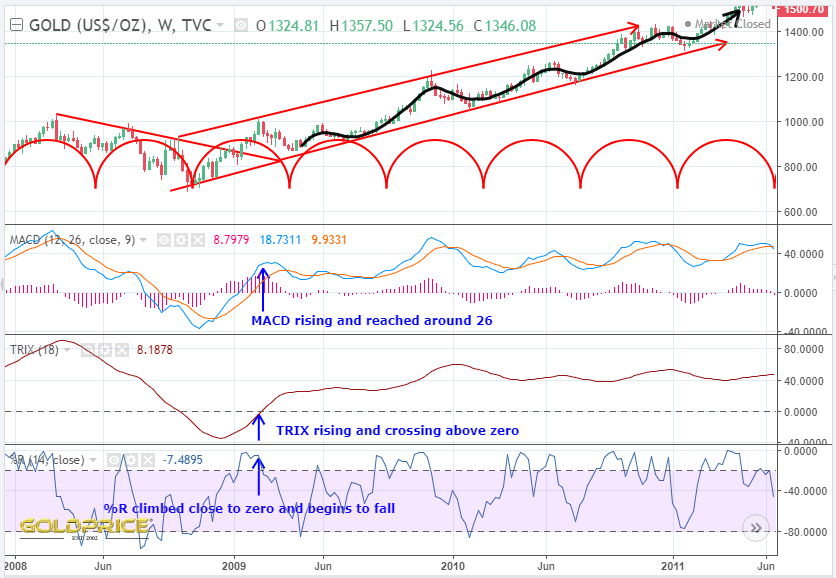
The ups and downs appear more exaggerated, but that’s just because the scales are slightly different. The recent rally out of the bullish triangle may have a little further to run. I looked more closely at how the indicators are lining up compared to 2009…
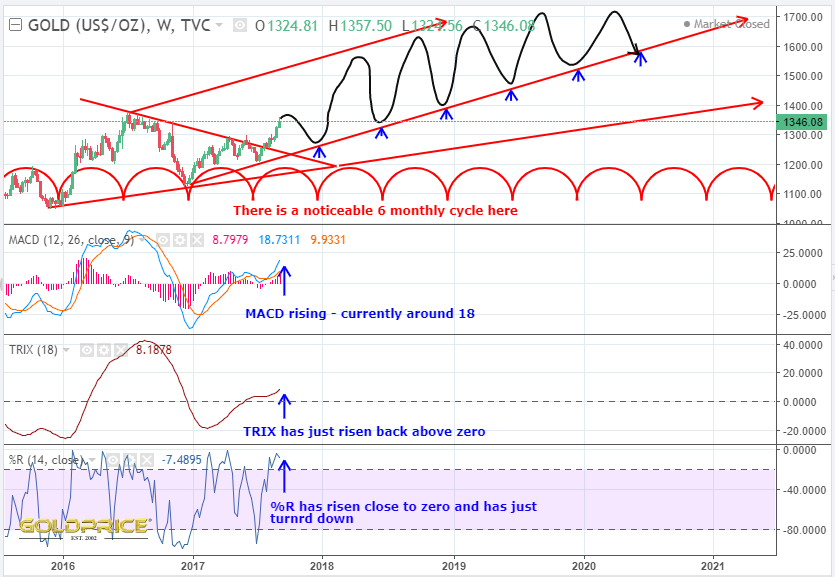
We appear to be getting close to a short term top. When price turns, and it may already have peaked, it’s a slide back to that support, wiping out most of the recent gains. We need to be realistic in our expectations – after that December low, we’re likely to see a much bigger surge in price. Rome wasn’t built in a day as they say. I’ll just sign off by sending my thoughts to anyone in the path of any of the terrible hurricanes heading through the Caribbean and towards the US, as well as large parts of South Asia. With recent, significant sea level rise, places like Miami are, in time, going to be unfit for habitation. It’s a very sad position we find ourselves in.
Very good. Yep, looking at many inverse H&S bottoms, it looks like a minimum of mid 2021 before any new highs. I’m on the same page as your post.
It’s going to take time, but I firmly believe the overall trend is now up.
I am not a firm believer in predictable cycles. Usually the cycle applier will site “inversions” when predicted cycles go awry. That said, I find it interesting on your second chart that the cycles predict gold getting pounded near the end of the year as far out as the eye can see. It certainly feels like that year end pounding has been the case recently. I wonder what has caused those year end poundings. Certainly discouraging to the average gold investor (like me), and maybe that’s the game plan.
Anyway, terrific work worth serious consideration. By the way, Northstar, you’re my fav analyst in the tent. Keep up the solid work.
“I wonder what has caused those year end poundings. Certainly discouraging to the average gold investor (like me), and maybe that’s the game plan.” Jim, I believe its the work of the gold bashing Christmas Grinch! He’s a mean one…LOL
Yes he is. A lump of coal for him for Xmas
Thanks Jim The longer term commodity, dollar and gold cycles are more reliable and exert the strongest force. Shorter term cycles lìke the 6 month one shown here have a good track record but can be thrown off more easily by external factors. I think of it like a force pushing price up or down which needs a larger external force in order to steer price away from its expected direction.
Northstar-any chance/way to do the same prognostication on GDX or HUI?
If I’m looking at your gold chart correctly and I now look at the HUI at the same time period, my attention should be drawn to the February 2009 high in the HUI around 325. From there the decline went to 250 with the correction ending in the beginning/middle of March. Have I identified area whose structure looks similar to where we are today?
Done
Many thanks NS. Will read now.
Thank you Northstar,great analysys
This is my question: What if gold(and silver) stocks will continue to outperform gold (and silver)as they did in the first leg of this new bull market that began in early january 2016? We should not forget that gold went from 1050 to 1360 (a 30% gain) but the HUI went from 100 to about 270 (almost a 200% gain) and the gdxj went from 10 to about 45 (more than a 300% move)
Could they end their own bull market well before bullion ?
Yes, they could. The timing of the top in PM stocks could well be a little different to Gold. It’s years away yet though, and we can monitor the charts for signs of topping as they unfold.
Thanks, nothing goes straight up, although in the short term 1300-1360 can feel like it.
Interesting NS. I like the idea of a possible channel similar to the last bull phase. Do post updates on that one.
Will do Graddhy. Thanks.
Great info. Thanks.