Fractal Of Hope
Still plenty of non-believers. Every correction/consolidation should carry on getting people worried for a while yet. It’s early days in the new (or continuing) bull. The charts have been screaming breakout and rally for months, with nothing (to my mind at least), supportive of a meaningful move down. Things can happen to catch us out though, so I never say ‘never’.
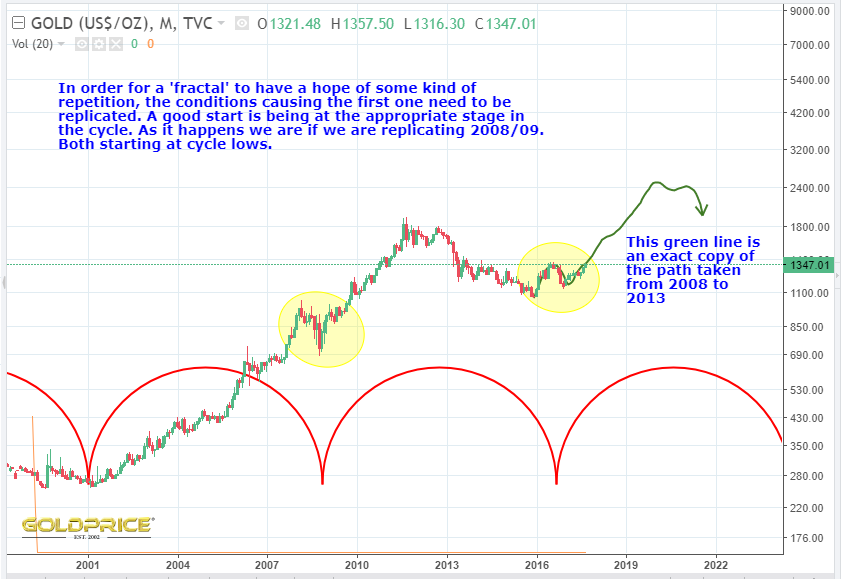
The following chart shows why I think the 2008/09 pattern may well be a fair guide as to where we may be going. For a pattern to repeat it needs a repeat of the environment which caused it. I believe we are at a very similar point in the gold cycle which will push price up as it did then. There are a million things that could make it rise at a different rate (most of them making it rise faster). However, I drew over the top of the 2008-2013 move and copied it across to the present day. It’s one possible roadmap. Interestingly it takes us to the $1500-$1550 region by April and then on to somewhere around $2500 in 2020. I think the biggest likelihood is that we will overshoot this by some distance. I’ll call this my fractal of hope.
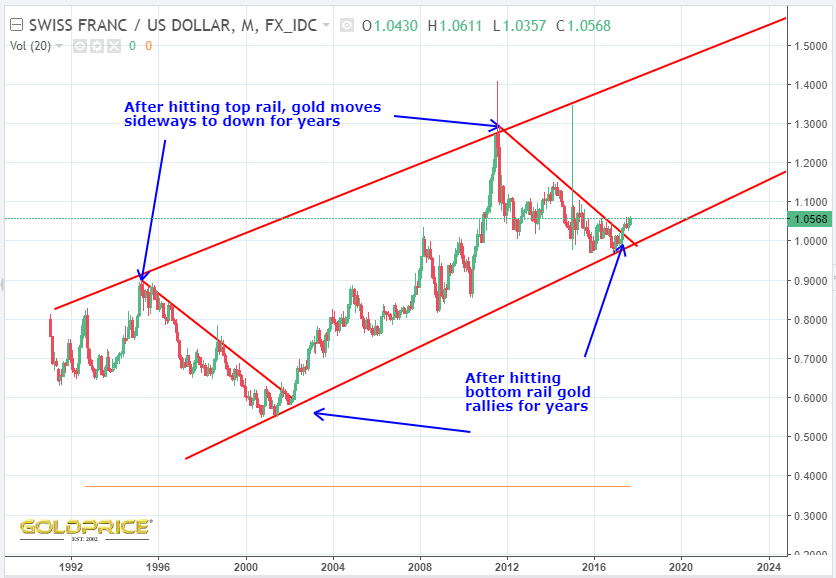
Just for good measure, here’s an update of the CHF/USD ratio chart that I’ve posted a couple of times.
Very nice, thanks! It’s a bit scary the rate at which the DXY and USDJPY are starting to totally fall apart. Anyone who isn’t long precious metals should have a list ready for any upcoming bounce.
Great arial view. Major breakdown today of support one the USDJPY in the making. Thank you for keeping an iron hand on the tiller. Something big seems to be brewing here.
Thanks both. There is a lot of pent up energy waiting to be released. The miners are lagging a little and need to move up around 20% to be close to where they were last time gold was $1350. We’ve gained $100 in a short space of time against the expectations of many. Personally, I like the bearish sentiment. Surprises should now be to the upside, with regular $20-30 pullback forming bull flags/triangles. So far, so good.
Between you and Graddhy (among others) it’s like having a couple of Nastrodamus:)
Thanks Gallo. I’ll keep a careful watch for any unexpected downside moves. Big picture though – the trend is now up for years to come. The global financial system is going to undergo some notable changes.
I’m still waiting for confirmation a breakout of Gold in the $EURO and the $CAD. What I am seeing is a Bear Market of the USD with the US SM ready to roll over Miners are just as vulnerable as most other stocks IMO. I certainly agree anybody denominated in USD needs to protect there wealth if the USD Index goes down to at 80 as is very likely. Gold has some big resistance EURO 1120 and 1160 just bounced off 1120. Throw NK in the mix interesting times.