This Is NOT A Coincidence – $2470 Target For Gold
This is both simple and astounding at the same time. Simple charting and calculations. Astounding in its implications. A target of $2470, and a likely overshoot to $3000 or so. The miners will increase by multiples on this next bull run. It really does look like the fireworks are about to start. Remember, this analysis, as compelling as it is, needs to be taken in context. A downside break of that $1160-$1180 area will mean that somehow, the Fed has managed to manipulate this thing into oblivion, and the reset will be even more dramatic. Unless that support breaks, this appears to be where we are heading. Two simple charts. One number from each chart. The numbers match precisely. Coincidence ? I don’t think so…
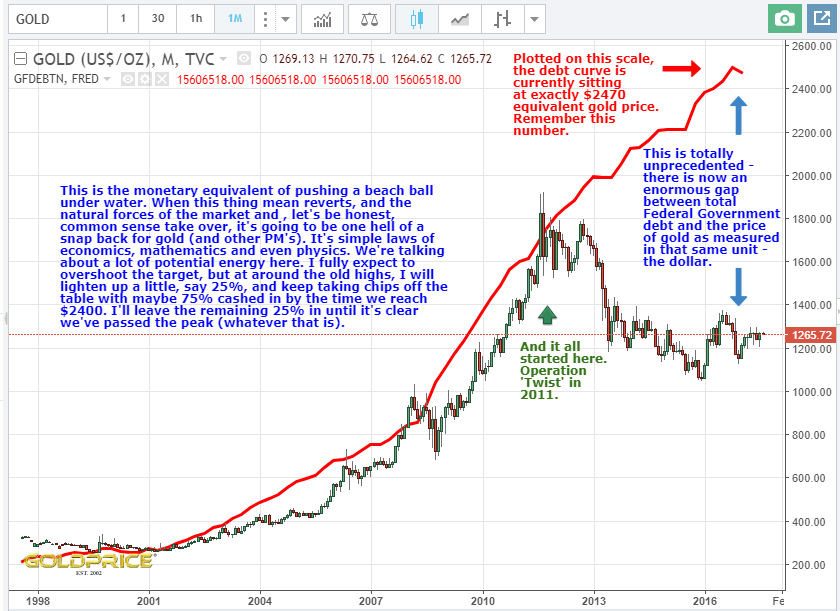

Edit: I lined the two graphs up so that the starting point (where they overlap) is the beginning of the bull run. They follow each other closely, as you’d expect, until 2011. My contention is that if money creation and debt is rising (in this case in a parabolic fashion), then gold will follow suit. Clearly this has been disrupted since 2011, but there really is no way I can see this situation continuing. It would make no sense whatsoever. Sense and natural forces always reassert themselves. To my mind, there can only be one outcome.
GDX is Stalling under the 50 SMA on the weekly with a small spinning top. DUST 60 wants to turn.
Another drop is likely as the dollar dead cat bounces. I’m expecting the big launch in August or September, but it could, technically be any time up until Jan or Feb next year.
Great Stuff Northstar
Simple is Good !
a Star is Rising
🙂
Cheers Fully. It’s odd, I tend to analyse the gold market in a similar way to forecasting the weather. It’s all about probabilities, weighing up possible future outcomes and working out the odds. As we often say in weather forecasting though, just because a horse is the 100:1 outsider, it doesn’t mean it can’t win the race. In other words, very low probability events can, and do occur. With PM’s that means looking down and being aware of the bear case, even though I’m very bullish at this point.
I share your optimism Northstar and love the weather analogy
I think there are many similarities. As a young forecaster I took quite a few knocks getting predictions wrong. Increased computing power has allowed us to foresee every possible future outcome so that however low the possibility, we know it’s there and can keep an eye on it.
Great post. Yep. Its gonna happen. Some of us may be dead 1st..lol.
I know how you feel Gary 😉
Serious work there NS.
Thanks Graddhy. Feels like putting a jigsaw together sometimes. These 2 pieces are a perfect fit 🙂