Gold Road Map – A New Parabola ?
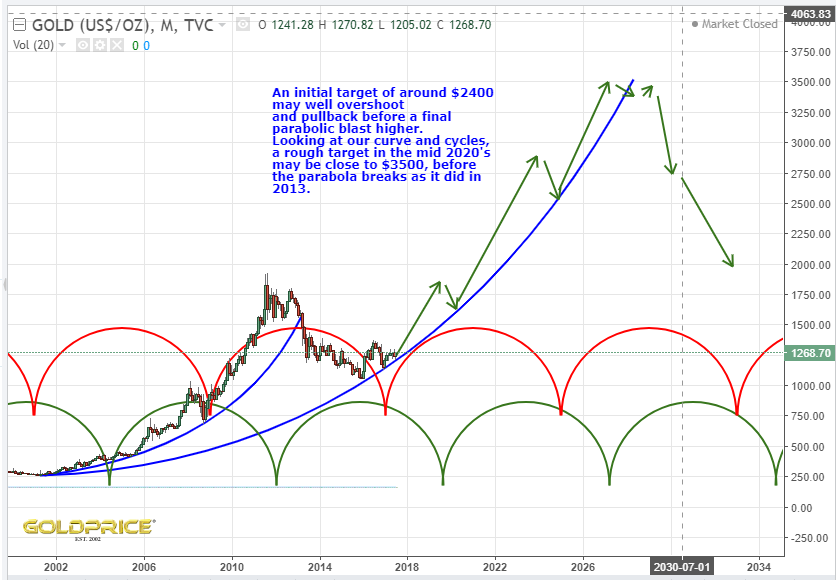
The last gold bull went parabolic, with the parabola eventually ‘breaking’ in 2013. The next one (now underway) will also be parabolic in nature. If you want to know why, just take a look at the unit we measure the ‘value’ of gold in – the dollar. That is going parabolic (and not in a good way)…
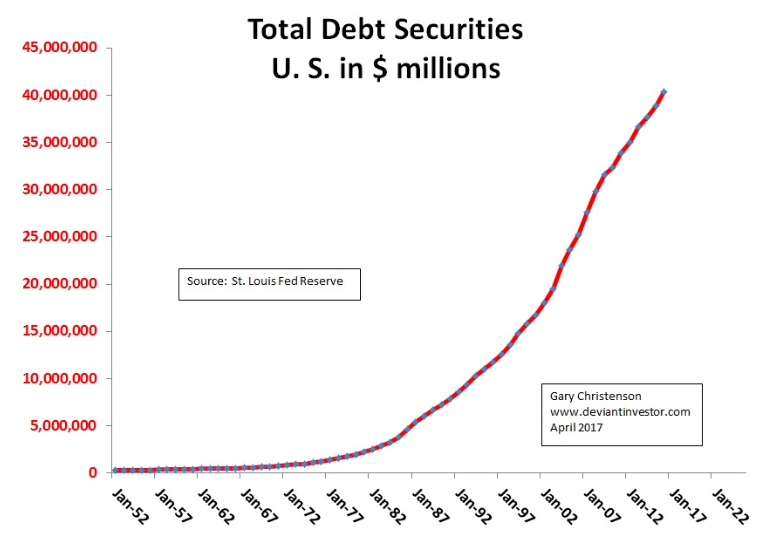
The US national debt is in a long term, unstoppable parabola. It’s anyones guess how this might end, but this upcoming bust is going to be a doozie.
Anyway, I’ve plotted the gold price in dollars, with a new parabolic uptrend, superimposed the cycles, and come up with a possible ‘road map’. Hope you find it useful…
Good stuff NS.
I for my part think that the parabolic move in gold will be much steeper than your chart. I think that after it takes out the ATH and do some BT, I think it just takes off. I am working on some charts.
Thanks Graddhy. As always, I look forward to reading your take on things. Some really interesting times ahead I think.
Both Northstar and Graddhy,in the 70’s gold bull market we had 3 big waves,2 up, one down.
The second wave up went from 100 to 870 in about 3 years.
if and only IF we are in the second wave up of the bull that started in 2001 and taking 1050(touched in late 2015-early 2016) as the bottom of this wave we could go to about 8000…but how long it will need to reach this target?
The 70’s bull market lasted about 10 years,we are in the 16th year of today’s bull market,so we could double all the calculation that will take us about to 2021 as the end of this bull.
But there are many,you included,that are thinking that this bull could end in the middle of the next decade or more.
My question: do you think that it’s more correct to use this next wave as the second wave up of the current bull market or do you think that we are in a completely new bull market so that we should not taking the 70’s bull market as an indicator?
I think any comparison that looks reasonable is useful since the situation that we have today has never existed towards the end phases of a monetary system previously; the whole planet on FIAT et c. I think all bets will be off at some point, when the big cracks come.
Here is what I wrote as a comment in a post about a year ago:
“I have some charts, will se if I can put a post together soon.
In the meantime, I think it is also possible to come a long way by just using very simple calculations. It is very linear yes but can give us a guideline for sure I think.
Let´s say GOLD goes to 10 000 in today´s monetary value which many of the best front runners agree upon. That´s about 8 times from here. Then the miners has a leverage on the metals with about 3-4, let´s say 3. That makes 8 x 3 = 24 times. Then we get 230 HUI x 24 = 5520. Times 4 is 7360. So I think that my number of circa 5000 that I got from, as you, checking charts and recalculating, is not that far off.
And let´s also look at silver miners especially. Let´s say GOLD goes to 10 000 and SILVER makes it to a 16th of that = 625. That´s 36 times from today´s 17. Then the miners also has at least 3-4 times the leverage. That leaves us with 36 times 3 = 100+.
On top of this: I think that GOLD will go to more than 10 000 and I think SILVER will go to at least 10:1 to GOLD.
Also, and as also Monovasia talks about below, I think that gold and the world the coming years will experience things that is so different from what have happened before, regarding the monetary and financial system, and this will flip any number we come up with on its head Í think.
This very simple stuff also tells us that silver miner indexes might go up more than 4 times gold miner indexes. And if SILVER goes far under 10:1, wow. And if the monetary system cracks in chunks and not all at once I also think it will be an extra wow.”
That’s not an easy one to answer Mamare, because using the past to predict the future can be perilous. History may not repeat, but it does rhyme. Since the gold standard was removed, I tend to view each bull and bear as occurring within a much larger bull market. If money creation is parabolic, gold (with intrinsic value) will rise in a parabolic fashion. I’m limiting my outlook to the next 5-10 years, because I intend to take my chips off the table within that timeframe. The charts will continue to lead my decisions and they are looking good at the moment. Unless the long term supports are broken, that will continue to be the case. I like to weigh up all the available evidence – COT’s, Elliott Wave, Wolfe Wave, fans, support, resistance, Fibonacci, sentiment, politics, fundamentals, etc, etc – it all helps to point us in the right direction. The future is seldom certain.
Mind blowing stuff guys!
Thanks to both !
For sure Silver has NOT yet broken the old 1980 top of $50 (as gold did ),so if we still are in a bull market ,we have a metal that is trapped by more than 35 years under a $50 dollar volcano,if it will broke that number it will literally explode.
It never ceases to amaze me how long the money printing madness has managed to keep a lid on things, but, I really do think time is running out and reality is approaching fast.
OOPs…stumbled into the wrong bar !
The Optomists Club !
$10,000 Gold $1,000 Silver….
Oy Vey Mojo….and I am selling at $1600
I’m not a real optimist…..but I really hope these guys above will be right
Ah…a Hopetomist !
Optimist club, lol. I’m working on the assumption this is a new bull, based on current evidence. As soon as the evidence suggests otherwise, I’ll be a bear. The high $1100’s is where I grow fur.