Simple Plan
Neildavis2002 just posted a brilliant simple chart of the HUI
Sometimes we over think the charts
Here I elaborated a little more (EDIT : Added the 50wma and 200wma on request by a member …these could be significant)
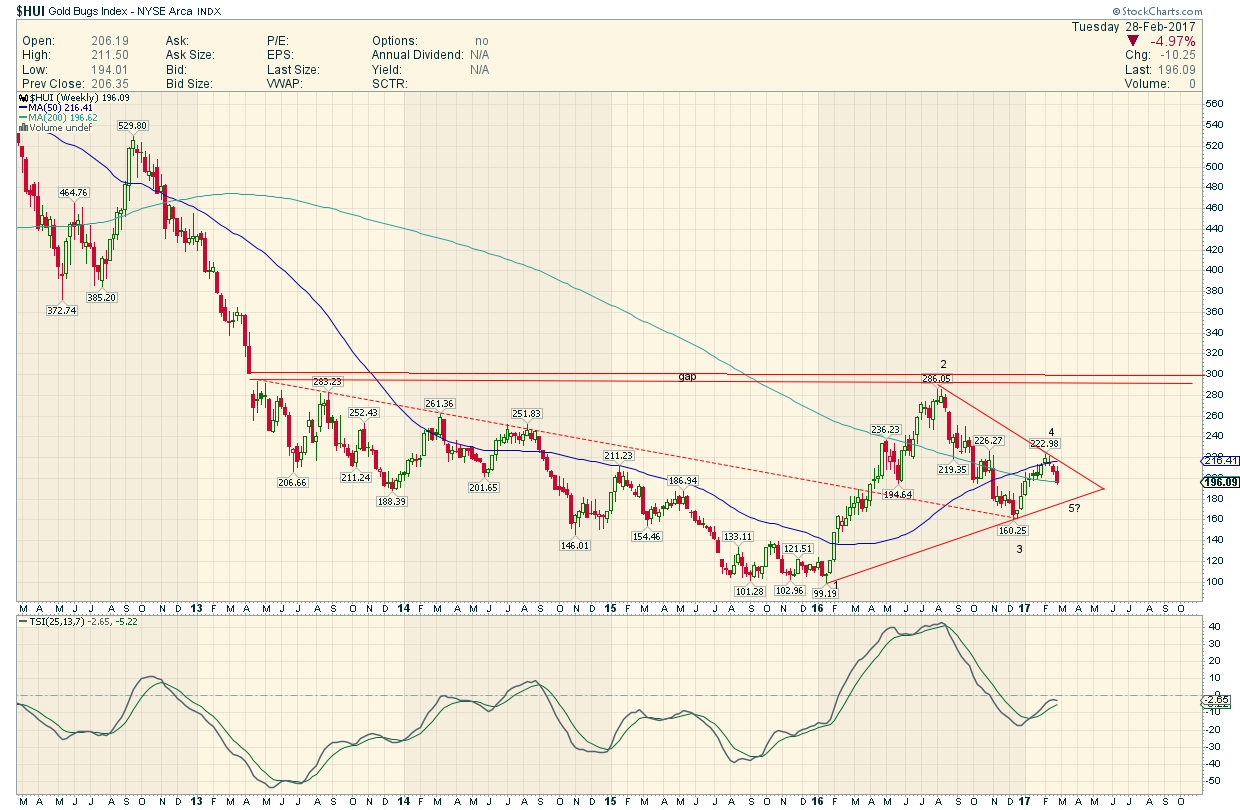
I find it Amazing that the run up in the first half of 2016 stopped right at the Bottom of that weekly gap
That Weekly Gap has stood there unchallenged for years…it is still OPEN
Also amazing the original dotted downtrend line was retested bang on.
The triangle is IT…If we hit the bottom rail we will have 4 complete reversals
After that …if we break back up and thru the downtrend its a Bull
If we break below the uptrend its a Bear.
Caveat…a quick break of either line followed by a reversal back around the apex would be extremely Bullish (if UP) or bearish (if Down)
Thanks Neil…this is THE chart to watch ! Watch this live link closely.
https://stockcharts.com/h-sc/ui?s=%24HUI&p=W&yr=5&mn=0&dy=0&id=p19831420190&a=509826748
WELCOME TO MY LIFE ( SIMPLE PLAN)
The TSI divergence is fascinating on that chart!
Thanks Fully!
Despite being the rookie that I am, I have to say that I will be following this chart on a daily basis. This thing is eye opening! It seems to make the not so obvious seem a lot more obvious. Thanks Neil Davis and Fully for bring this much needed perspective to my attention!
I added 2 important moving averages..price is presently trapped between them
I changed the link to have these appear…you should copy the new link Optional
Thanks Fully. I like simple, and have been watching price bounce around between those moving averages lately.